Kalinga


-hiuxf8.png)


Population

1, 797, 660
Total Population
as of May 01, 2020
Total Population
as of May 01, 2020
Population Density

91
Growth Rate
as of May 01 2020
Growth Rate
as of May 01 2020
Prices

4.0%
Inflation Rate
December 2024
Inflation Rate
December 2024
Population Growth Rate

0.91%
2015-2020
2015-2020
Gross Regional Domestic Product
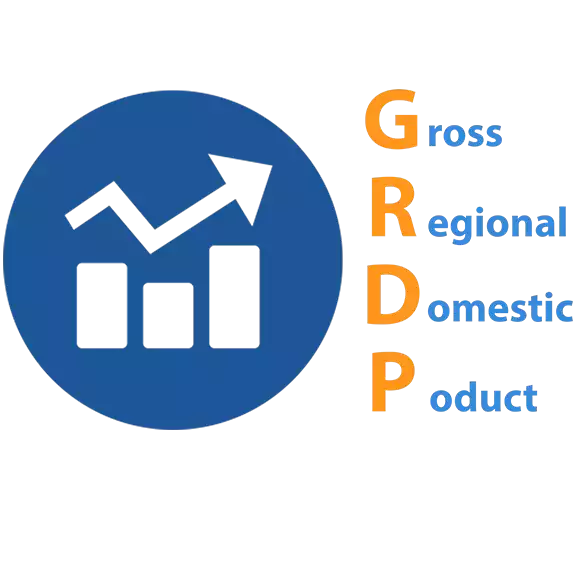
361,078,914
as of April 2024
as of April 2024
GRDP Growth Rate
6.9%
2022-2023
as of April 2024
2022-2023
as of April 2024
Gross Value Added in AFF

27,751,780
as of April 2024
as of April 2024
Gross Value Added in Industry

87,404,199
as of April 2024
as of April 2024
Gross Value Added in Services

245,922,935
as of April 2024
as of April 2024


Some of the most commonly asked questions and corresponding solutions regarding civil registration are found in this page.
Ways on how to request data from PSA:
- Fill out the online Data Request Form (https://beta.psa.gov.ph/content/data-request-form).
- Contact the PSA Information Section (by email: info@psa.gov.ph or by phone: 8462 6600 loc. 839) and provide details on your data request.
- Visit the Freedom of Information (FOI) portal (https://www.foi.gov.ph/). For more information, see the PSA's FOI Procedures Manual | People's Manual.
- Visit the PSA Library at 5/F, CVEA Bldg., PSA Complex, East Avenue, Diliman, Quezon City.
- Send a letter requesting for dataset addressed to the PSA National Statistician.
Read More
I. Overview of the PhilSys
WHAT IS REPUBLIC ACT NO. 11055?
Republic Act No. 11055, or the Philippine Identification System Act, was signed by President Rodrigo Roa Duterte on 06 August 2018. It is an act establishing a single national identification system that aims to provide valid proof of identity for Filipino citizens and resident aliens of the Philippines.
WHAT IS PHILSYS?
The Philippine Identification System or PhilSys refers to the government’s central identification platform for all Filipino citizens and resident aliens of the Philippines.


.png)
.png)
.png)

| Title | Attachment | Release Date |
|---|---|---|
| Kalinga Quickstat for July 2025 |
|
|
| Kalinga QuickStat for June 2025 |
|
|
| Kalinga QuickStat for May 2025 |
|
|
| Kalinga QuickStat for April 2024 |
|
|
| Kalinga QuickStat for March 2025 |
|
|
| Kalinga QuickStat for February 2025 |
|
|
| Kalinga QuickStat for January 2025 |
|
|
| Kalinga QuickStat for December 2024 |
|
|
| Kalinga QuickStat for November 2024 |
|
|
| Kalinga QuickStat for October 2024 |
|