

The Provincial Product Accounts (PPA) is a mechanism to compile the Gross Domestic Product (GDP) using the production approach and other economic accounts at the subregional level. It is aligned with the Philippine System of National Accounts (PSNA) that aims to present a comprehensive picture of the provincial and Highly Urbanized City (HUC) economies. By providing a more appropriate measure and assessment of a province’s economic performance, the PPA is viewed to strengthen the planning and decision-making of local level policy makers and other stakeholders.
This Special Release presents the economic performance of the City of Baguio in 2023.
Baguio City posts 9.0% growth in 2023, fastest in Cordillera
The economy of the City of Baguio further grew from the PhP155.11 economic output in 2022 to PhP169.12 billion in 2023. The city remained to be the fastest growing economy among all provinces and Highly Urbanized City (HUC) in the region with 9.0% growth rate.
The estimated Gross Domestic Product (GDP) of the city in 2023 continued to surpass the pre-pandemic level by PhP16.26 billion.
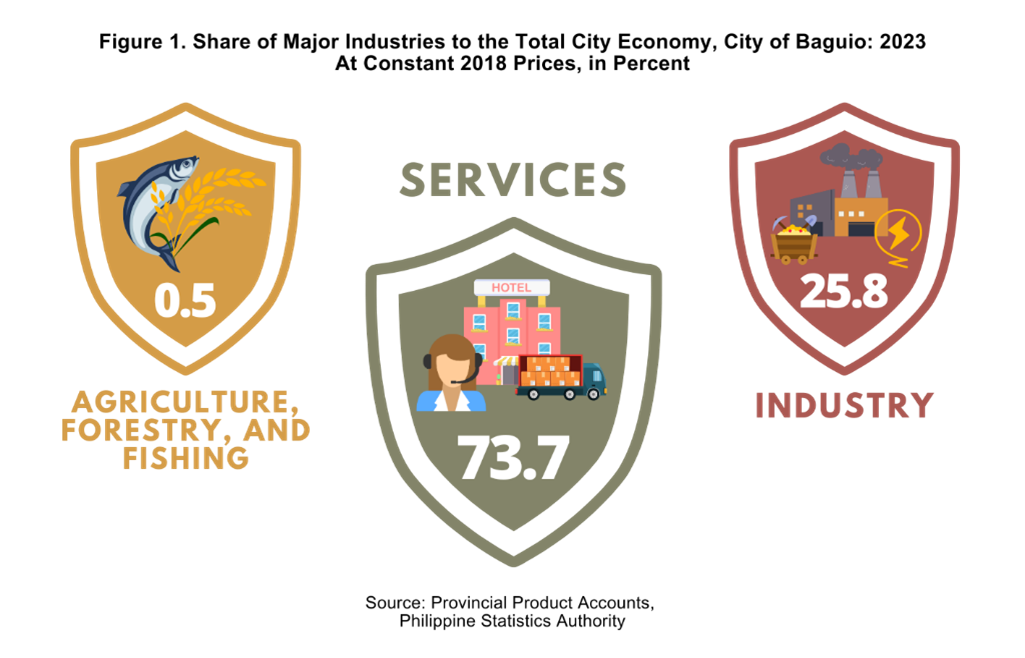
The economy is comprised of three major industries namely: Agriculture, Forestry, and Fishing; Industry and Services. Among these, Services accounted for almost three-fourths of the 169.12-billion-peso economic output of the city with a 73.7% share followed by Industry with a 25.8% share and Agriculture, Forestry, and Fishing with a minimal 0.5% share.
In terms of contribution to the 9.0% growth rate of the city, Services remained to be the main driver of the economy contributing 7.5 percentage points. Industry further accelerated the city’s economy by 1.5 percentage points. Meanwhile, Agriculture, Forestry, and Fishing slowed down the economy by 0.02 percentage points.
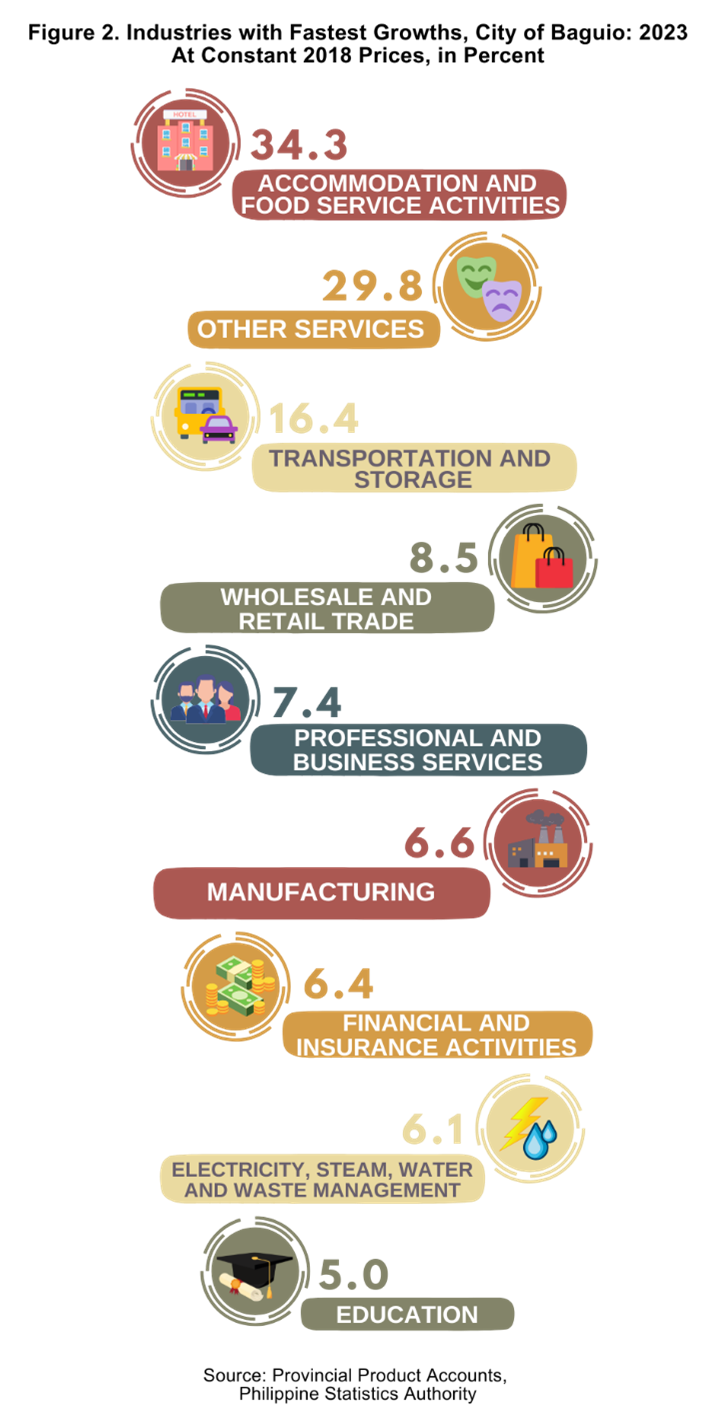
Tourism-associated industries boost Baguio’s economy
The resumption of travel and re-opening of businesses played a major role in the recovery of various industries in the city in 2023. This was observed in tourism-tied industries such as Accommodation and food service activities, which grew by 34.3%; Other services growing by 29.8%; and Transportation and storage with a 16.4% growth.
With Accommodation and food service activities further improving by 34.3% from its recorded 51.8% growth in 2022, the industry facilitated the growth of the city’s economy with 2.7 percentage points, the biggest contributor in 2023.
All the remaining industries recorded growths in 2023 except Agriculture, forestry, and fishing, and Public administration and defense; compulsory social activities that contracted by 2.6% and 0.2%, respectively.
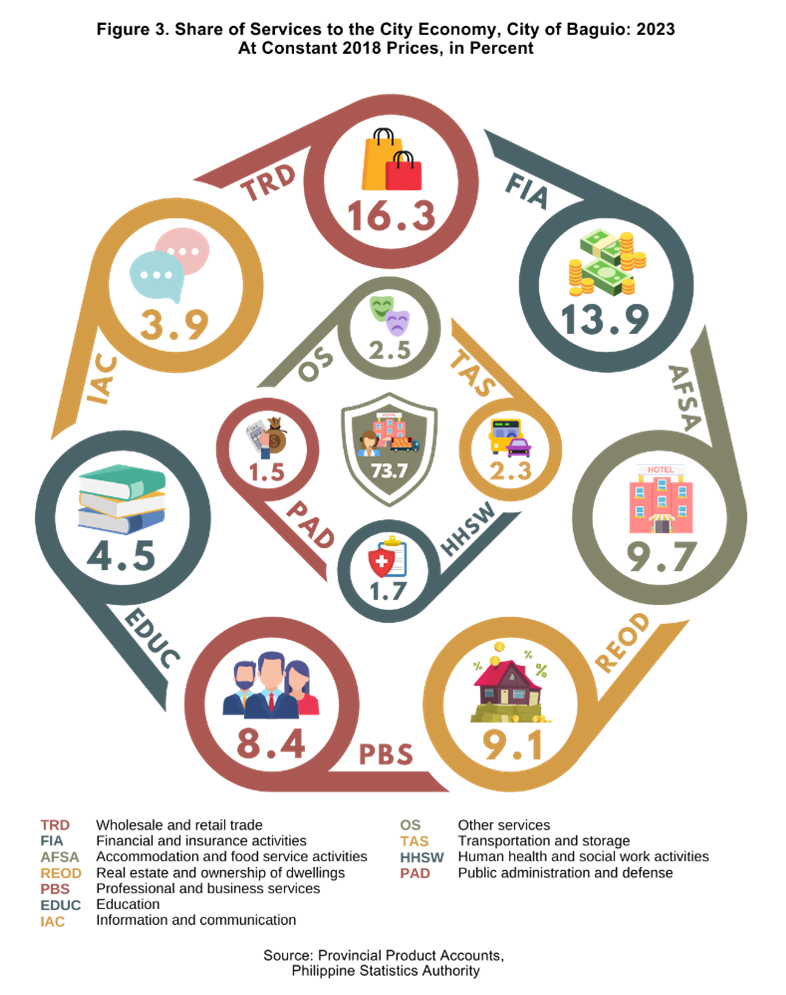
Of the 73.7% share of Services, Wholesale and retail trade; repair of motor vehicles and motorcycles accounted for the largest share with 16.3%. This was followed by Financial and insurance activities with 13.9%, Accommodation and food service activities with a 9.7% share, Real estate and ownership of dwellings with a 9.1% share, and Professional and business services with an 8.4% share to total Services.
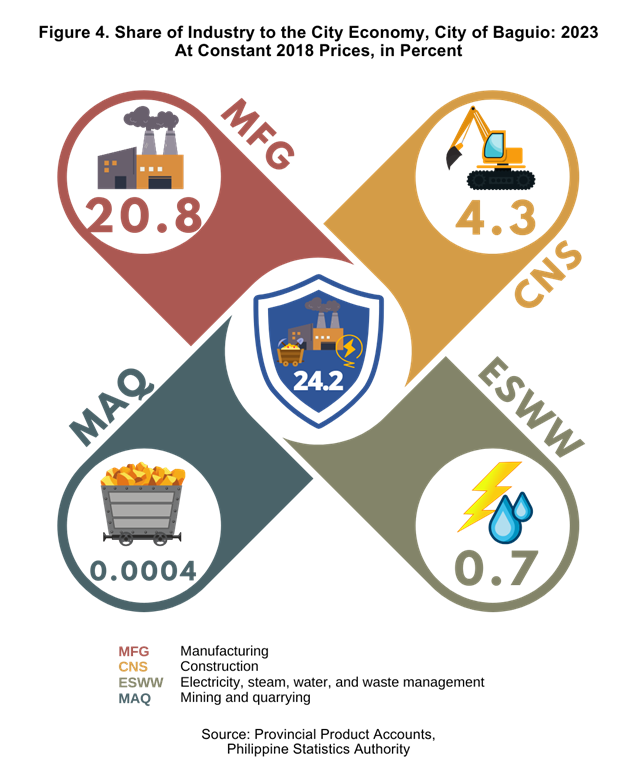
On the other hand, Industry was comprised of Manufacturing with a 20.8% share, Construction with 4.3%, Electricity, steam, water, and waste management with 0.7%, and Mining and quarrying with a 0.0004% share.
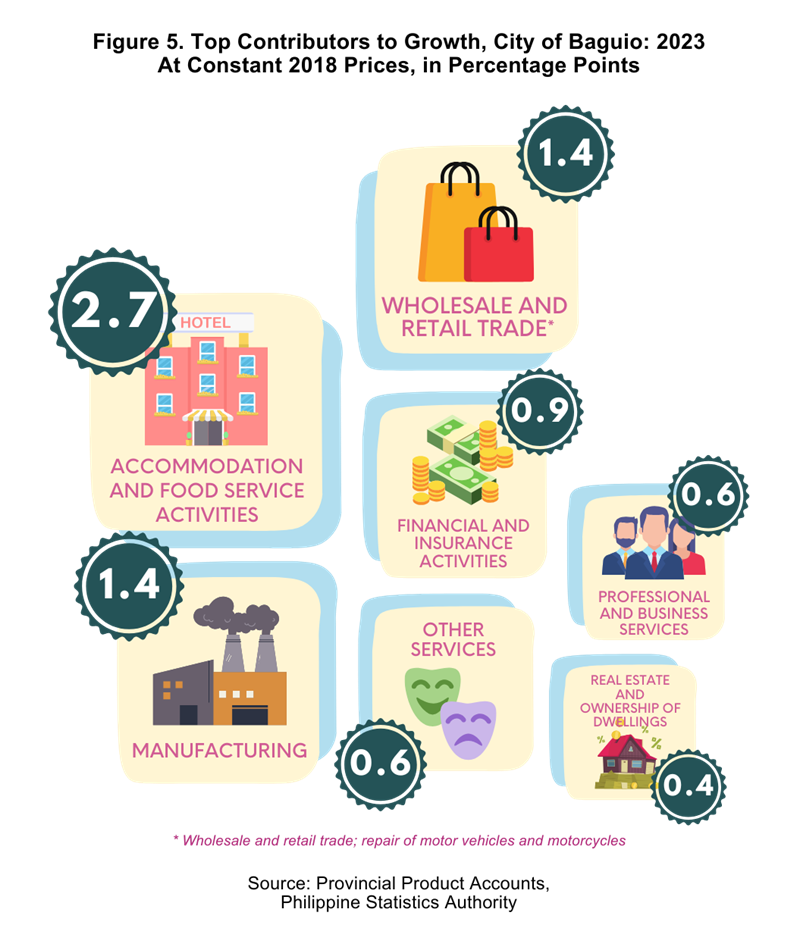
Accommodation and food industry steers Baguio economy in 2023
The 9.0% growth of the economy of the City of Baguio was mainly driven by Accommodation and food service activities and Wholesale and retail trade; repair of motor vehicles and motorcycles with an accumulated 2.7 percentage point contribution to the growth. Other industries under Services further steered economic growth by 4.8 percentage points.
With this, Services accounted for 7.5 percentage points of the growth of the economy of the city in 2023. Industry further accelerated the economy by 1.5 percentage points. However, Agriculture, Forestry, and Fishing failed to bounce back thus slowing down the economy by 0.02 percentage points.
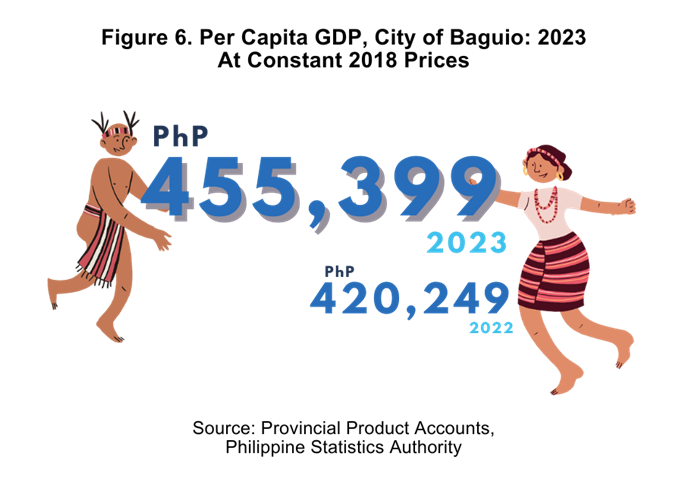
City of Baguio per capita output breaches PhP450,000 mark
Per capita GDP measures how much an individual contributes to the provincial/highly urbanized city economy. At constant 2018 prices, the per capita GDP of the City of Baguio, or the total city GDP levels divided by the total city population, was estimated at Ph 455,399 in 2023. This was 8.4% higher than the PhP420,249 per capita GDP estimated in 2022. The per capita GDP of the City of Baguio in 2023 was higher than the regional per capita GDP of PhP195,162.
Baguio City is the fastest growing sub-regional economy in 2023
All sub-regional economies of CAR expanded in 2023. Two provinces/HUC recorded growths that were faster than the 6.9 regional growth rate. The economy of the City of Baguio grew the fastest with 9.0%. Mountain Province economy posted the second fastest growth with 6.7%. This was followed by Kalinga, Benguet, and Apayao with 6.0%, 5.1%, and 4.6% growths, respectively.
(SGD)
VILLAFE P. ALIBUYOG
Regional Director
Designation Initials Date
CSS AFRBJ 14 Jan 2025
SSS WBM
SS II KAMC
Technical Notes
Gross Domestic Product (GDP)
• The aggregate of gross value added (GVA) of all resident producer units in a province/city.
• Measures the economic performance of the province/ city from the perspective of the producers of goods and services. It covers the value of goods and services produced in the region during the reference period.
The GDP classification by industry adopts the 2009 Philippine Standard Industrial Classification (2009 PSIC). This configuration is also revised in the overall revision and rebasing to highlight additional industries, which are Information and Communication, Accommodation and Food Service Activities, Professional and Business Services, Education, and Human Health and Social Work Activities.
A. Agriculture, Forestry, and Fishing
B. Industry
1. Mining and quarrying
2. Manufacturing
3. Electricity, steam, water, and waste management
4. Construction
C. Services
1. Wholesale and retail trade; repair of motor vehicles and motorcycles
2. Transportation and storage
3. Accommodation and food service activities
4. Information and communication
5. Financial and insurance activities
6. Real estate and ownership of dwellings
7. Professional and business services
8. Public administration and defense; compulsory social activities
9. Education
10. Human health and social work activities
11. Other services

