

Release Date :
Reference Number :
25CAR32-879
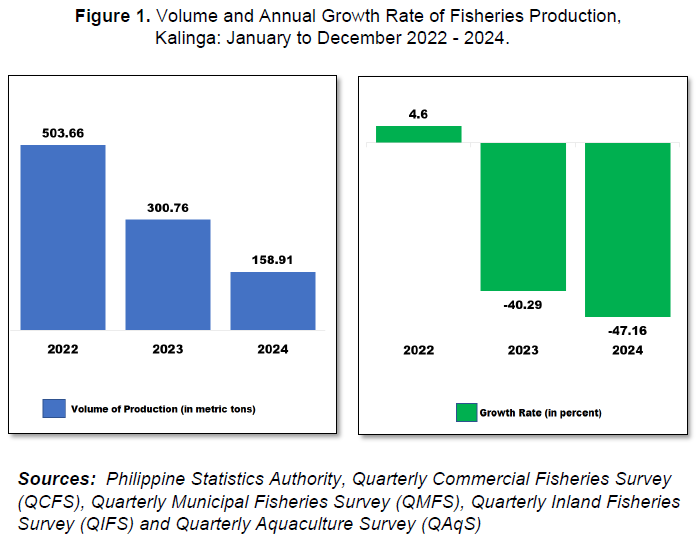
Fisheries production in Kalinga declined by 47.16 percent in 2024
The total volume of fisheries production in 2024 was registered at 158.91 metric tons. It indicates an annual decrease of 47.16 percent from the 300.76 metric tons output in 2023. Decreases in production were noted both for inland municipal fisheries and aquaculture subsectors. (Figure 1 and Table 1)
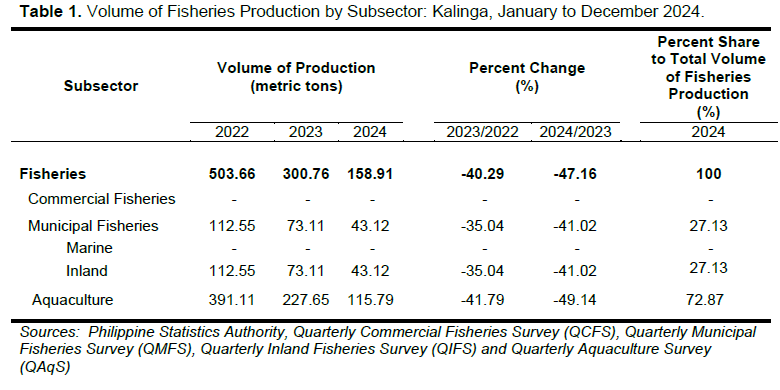
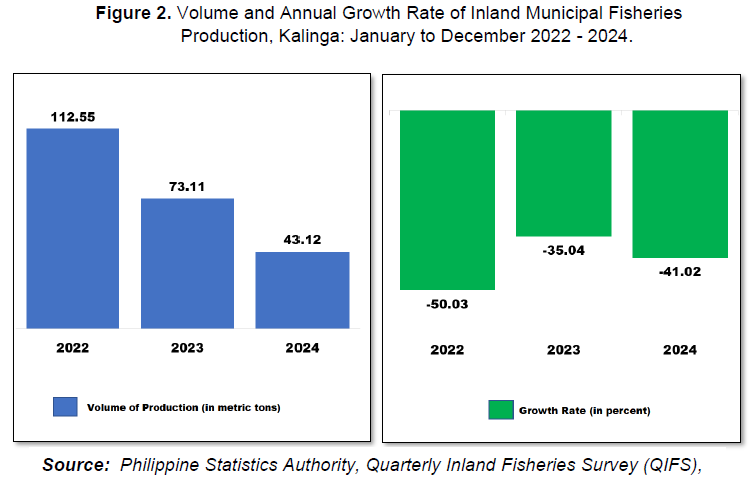
During the year, inland municipal fisheries production was recorded at 43.12 metric tons. It went down by 41.02 percent from the previous year’s estimate of 73.11 metric tons. The subsector contributed 27.13 percent to the total fisheries production in 2024. (Figure 2 and Table 1)
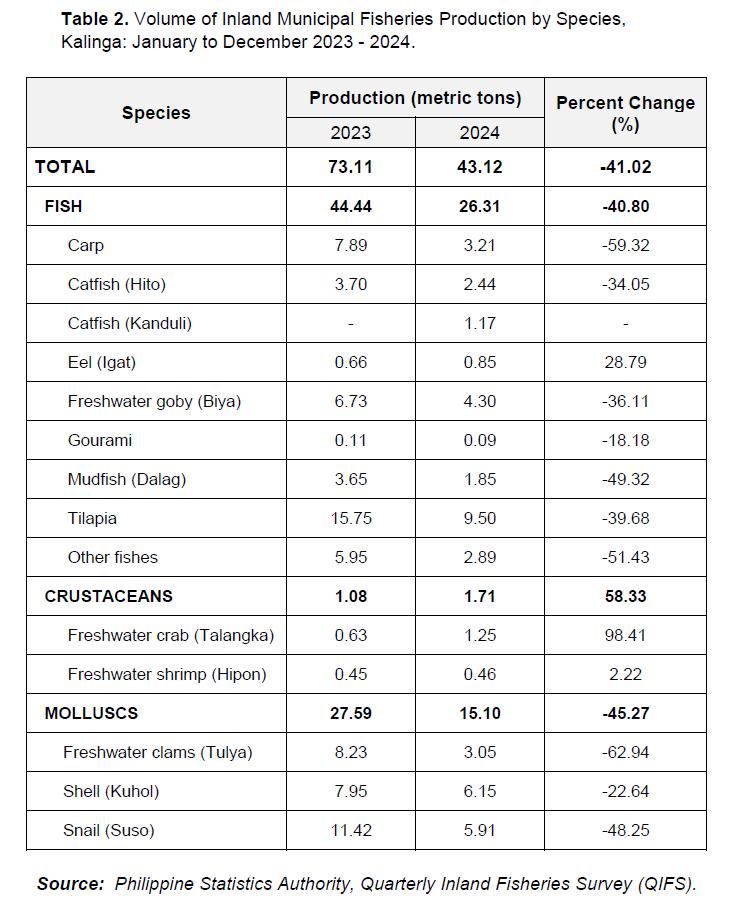
Majority of the inland species registered decreases in production. Highest decrease for fish species were noted in Carp (59.32%), Other fishes (51.43%), and Mudfish (49.32%).
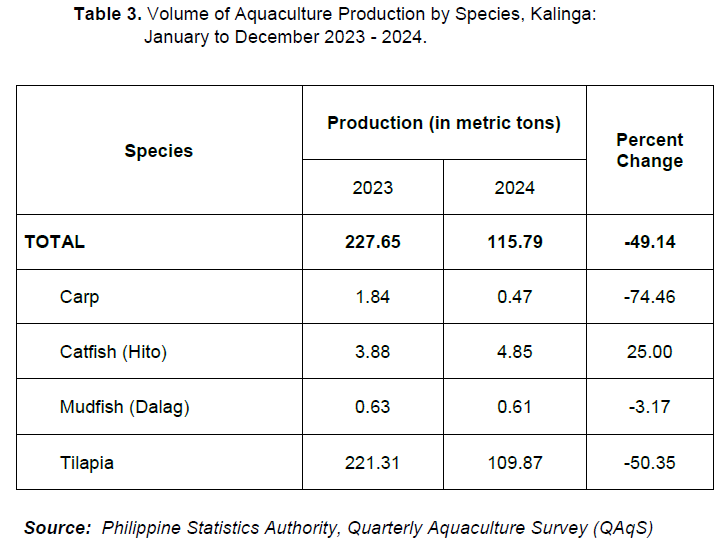
Aquaculture production was registered at 115.79 metric tons in 2024. This was lower by 49.14 percent from the previous year’s output of 227.65 metric tons. The aquaculture subsector constituted the biggest share of 72.87 percent to the total fisheries production in 2024. (Figure 3 and Table 1)
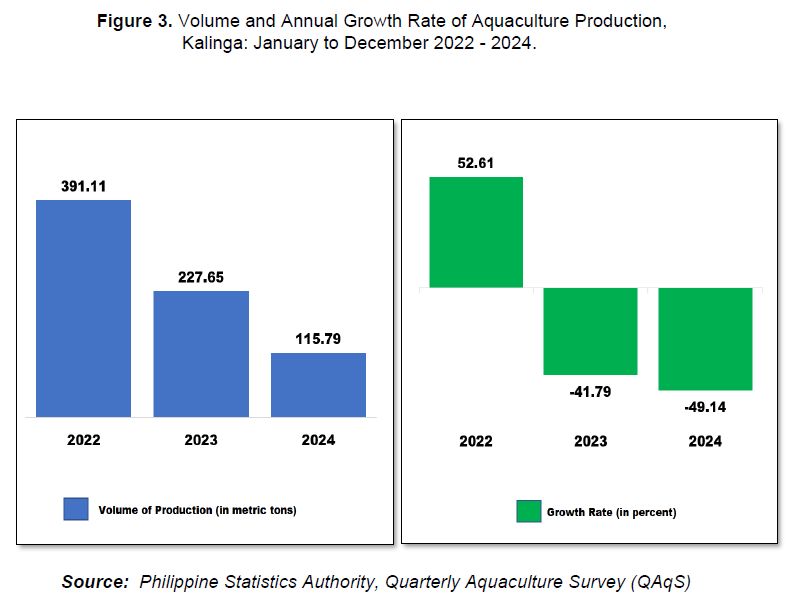
The decline was attributed to the decreases in the production of Carp (74.46%), Tilapia (50.35%), and Mudfish (3.17%). On the contrary, an increase in the production of Catfish (25.00%) was noted for the year 2024.
sgd.
MARIBEL M. DALAYDAY
Chief Statistical Specialist
| Attachment | Size |
|---|---|
|
|
296.61 KB |