

Release Date :
Reference Number :
25CAR32-875
Overall Inflation
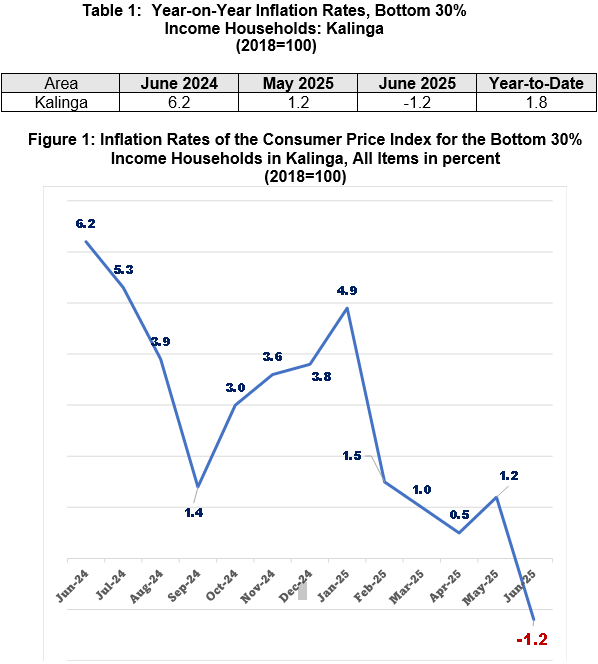
The Kalinga’s inflation rate for the Bottom 30% income household decreased to -1.2 percent in June 2025 from 1.2 percent in May 2025. This makes the provincial average inflation at 1.8 percent. In June 2024, the inflation rate was higher at 6.2 percent.
Main Drivers to the Downward Trend of the Headline Inflation
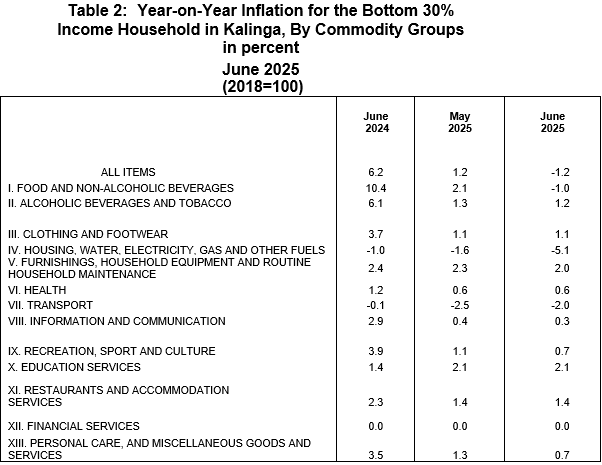
The decrease in the overall inflation for the Bottom 30% Income Households in June 2025 was primarily brought about by the monthly decrease of the following items:
a. Housing, water, electricity, gas and other fuels at -5.1 percent from -1.6 percent;
b. Food and non-alcoholic beverages with -1.0 percent from 2.1 percent;
c. Recreation and culture at 0.7 percent from 1.1 percent;
d. Information and communication with 0.3 percent from 0.4 percent;
e. Personal care, goods and miscellaneous services at 0.7 percent from 1.3 percent;
f. Furnishings, household equipment and routine household maintenance at 2.0 percent from 2.3 percent and
g. Alcoholic beverages and tobacco at 1.2 percent from 1.3 percent.
On the other hand, there is an increase from the group of Transport at -2.0 percent from -2.5 percent.
Meanwhile, there is no change in the commodity group of Clothing and Footwear, Health, Financial Services, Education Services, and Restaurants and Accommodation Services
Food Inflation
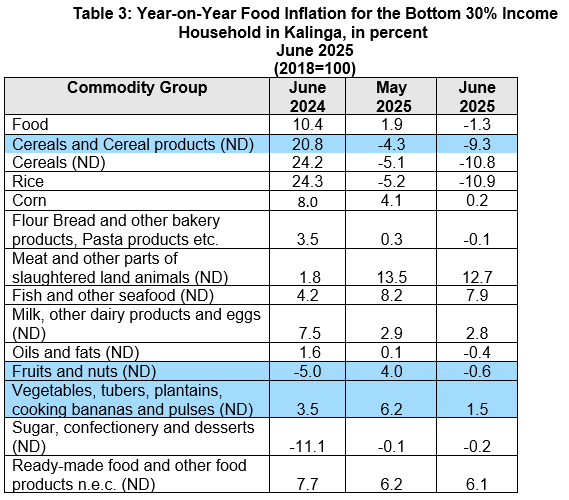
Food deflation at the provincial level for the bottom 30% income household decreased to -1.3 percent in June 2025 from 1.9 percent in the previous month. In June 2024, food inflation was higher at 10.4 percent.
Main Drivers to the Downward Trend of Food Inflation
The deceleration of food inflation in June 2025 was primarily brought about by the following groups:
a. Cereals (ND) with -9.3 percent from -4.3 percent;
b. Vegetables, tubers, plantains, cooking bananas and pulses with 1.5 percent from 6.2 percent;
c. Fruits and nuts with -0.6 percent from 4.0 percent;
d. Meat and other parts of slaughtered land animals with 12.7 percent from 13.5 percent;
e. Fish and other sea foods with 7.9 percent from 8.2 percent;
f. Milk, other dairy products and eggs with 2.8 percent from 2.9 percent;
g. Ready-made food and other food products n.e.c. with 6.1 percent from 6.2 percent;
h. Sugar, confectionery and desserts with -0.2 percent from -0.1 percent and
i. Oil and fats with -0.4 percent from 0.1 percent.
Main Contributors to the Headline Inflation
The top three (3) commodity groups contributing to the June 2025 overall inflation were the following:
a. Cereals and other cereal mproducts;
b. Vegetables, tubers, plantains, cooking bananas and puluits and nuts (ND).
c. Fruits and nuts (ND).
Main Contributors to the Food Inflation
The top three (3) food groups in terms of contribution to the food inflation during the month were the following;
a. Cereals and other cereal products;
b. Vegetables, tubers, plantains, cooking bananas and pulses and
c. Ready-made food and other food products (ND)
sgd.
MARIBEL M. DALAYDAY
Chief Statistical Specialist