

Age-sex pyramid of CAR: 2010 and 2015
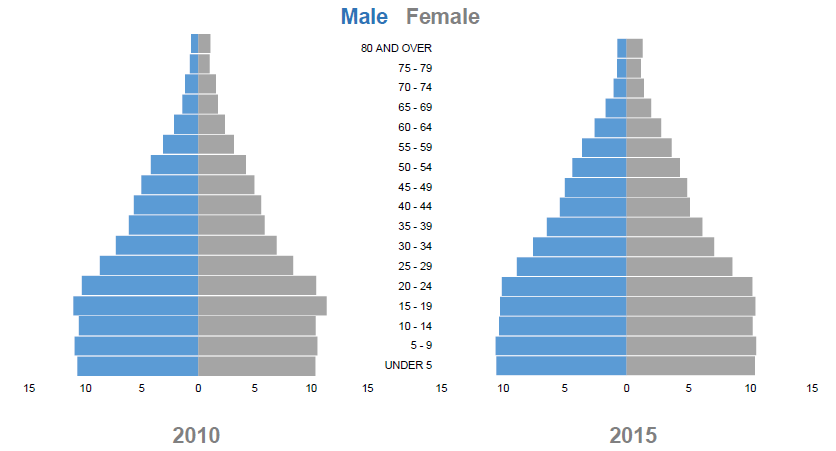
- The age-sex distribution of the population in 2010 showed that children aged 15 to 19 years comprised the largest age group with 11.2 percent of the household population. While in 2015, the largest group were children aged 0 to 4 years and aged 5 to 9 years, with each making up 10.5 percent of the household population. Followed by those in the age groups 10 to 14 years and 15 to 19 years both at 10.3 percent of the household population.
- Both in 2010 and 2015, men dominated the women in the age group 0 to 59 years. Women, on the other hand, outnumbered the men in the older age group 60 years and over.
- In 2015, the working age 15 to 64 years comprised 64 percent of the household population in the region. Children below 15 years of age comprised 31 percent while older persons (65 years and over) comprised 5 percent of the household population.
Figure 1. Age-Sex Pyramid, CAR: 2010 and 2015
 Source: Philippine Statistics Authority
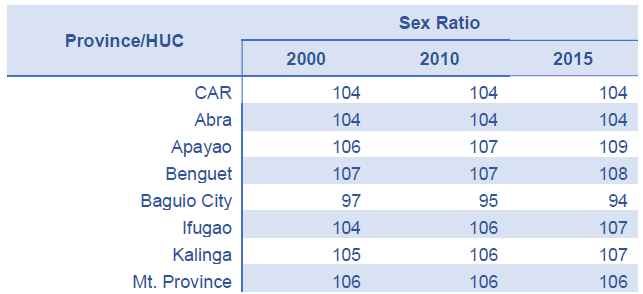
Sex ratio: 2000, 2010 and 2015
- The census data on male and female for the region in 2015 revealed a sex ratio of 104 males to 100 females. This ratio is also evident in the census years 2000 and 2010. In general, CAR has more men than women.
- A sex ratio that is less than a hundred means that there are lesser males than females. Baguio City had sex ratios less than 100 in census years 2000, 2010 and 2015. Baguio City remained the lowest across census years in terms of sex ratio. Apayao had the highest sex ratio of 109 males to 100 females in 2015. Followed by Benguet with 108.
Table 1. Sex Ratio by Province/Highly Urbanized City, CAR: 2000, 2010 and 2015
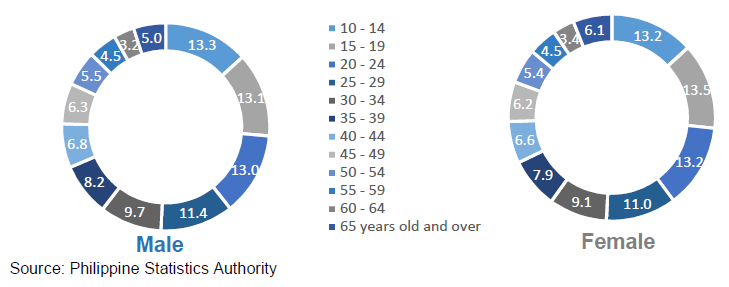
Simple literacy rate of the region
- There were more literate men than women in the CAR in 2015. Men comprised 51 percent of the total literate household population 10 years old and over.
- In males, those aged 10 to 14 years old were the most literate with 13.3 percent. In females, the most number of literate were from age group 15 to 19 years with 13.5 percent.
Figure 2. Percent Distribution of Literate Persons Aged 10 Years Old and Over
by Age Group and Sex, CAR: 2015
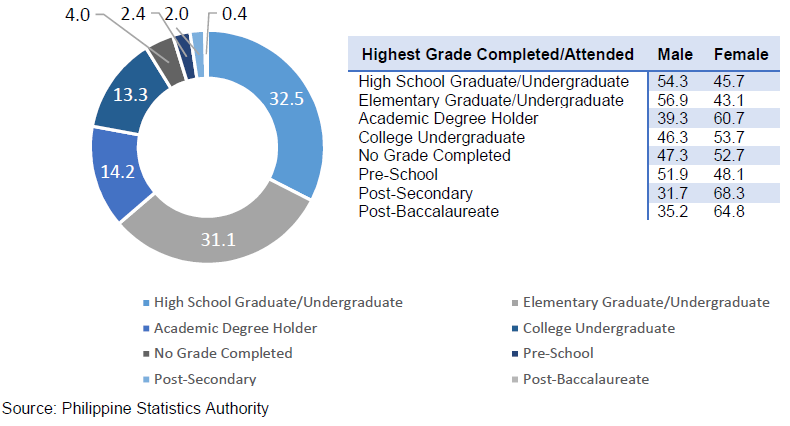
Highest grade completed or attended
- High school graduates including undergraduates made up 32.5 percent of the total population of 5 years old and over of the region. While elementary graduates and undergraduates made up 31.1 percent.
- Academic degree holders comprised 14.2 percent of the total population 5 years old and over. Out of this percentage, 39.3 percent were men and 60.7 percent were women. This means that in 2015, there were more women who completed a college degree than men in the region. There were 13.3 percent college undergraduates enumerated in 2015. Of which 46.3 percent were men and 53.7 percent were women.
- Of the total population of 5 years and over, there were persons enumerated in CAR who were not able to complete any grade level (4.0 percent). There were more women who did not finish a grade or level (52.7 percent).
- Among those with baccalaureate degree in the region (4.0 percent), there were more women (64.8 percent) than men (35.2 percent).
Figure 2. Total Population of 5 Years Old and Over by Sex and
Highest Grade Completed/Attended, CAR: 2015
Gainful workers 15 years old and over
- In 2015, the region listed 746,019 gainful workers 15 years old and over. Of which, 62.8 percent were males (468,639 workers) while the remaining percentage were females with 277,380 workers.
Figure 3. Total Gainful Workers of 5 Years Old and Over by Sex, CAR: 2015
- Most workers entered elementary occupations. Occupations in this group involve the performance of simple and routine tasks which may require the use of handheld tools and considerable physical effort. There were more men (107,951 workers) than women (100,517 workers) under this type of occupation.
- The least number of workers were those involved in the armed forces occupations. There were only 199 women and 3,825 men who work for the armed forces.
Table 2. Number of Gainful Workers 15 Years Old and Over by Sex and
by Province/Highly Urbanized City (HUC), CAR: 2015
