

Population
Males outnumbered females by 7.12 percent in terms of Total Population
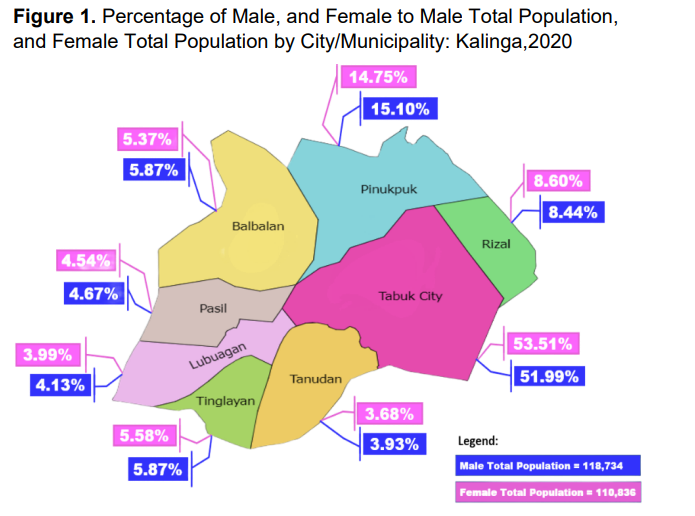
Based on the 2020 Census of Population and Housing (2020 CPH), as of May 1, 2020, Kalinga had a Total Population of 229,570. (Table 1)
More than half or 51.72 percent (118,734 persons) of the total population were male, while the remaining 48.28 percent (110,836 persons) were female. (Table 1)
The City of Tabuk and the seven (7) municipalities were dominated with men. More than half of the male total population or 51.99 percent (61,726 persons), and female total population or 53.51 percent (59,307 persons) were in the City of Tabuk. (Table 1)
Males outnumbered females by 6.9 percent in terms of Household Population
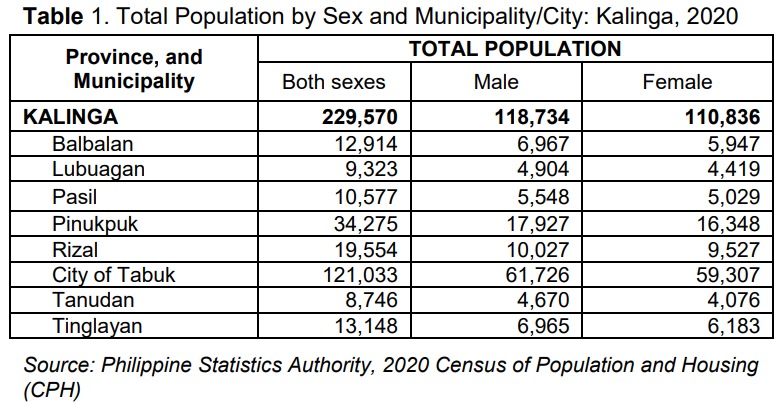
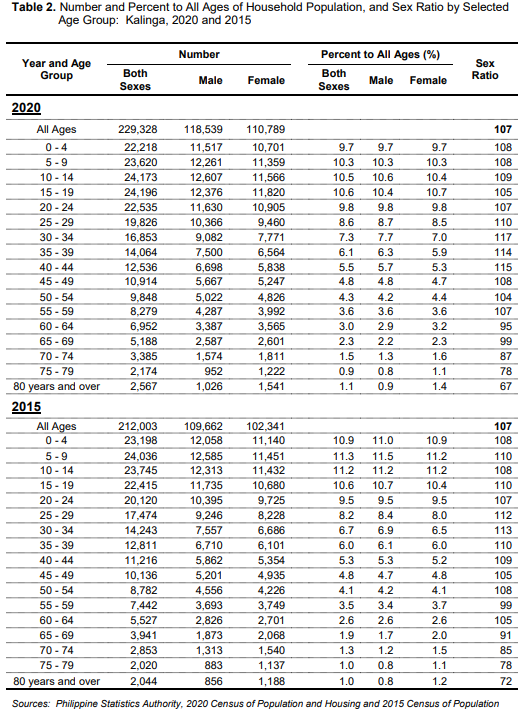
Of the province’s total population (229,570 persons), 99.89 percent or 229,328 persons form part of the household population. Men dominated the province’s household population with 118,539 persons or 51.69 percent while women comprised the remaining 48.31 percent or 110,789 persons. (Table 2)
The City of Tabuk had the greatest number of household population for both men and women. It is followed by the Municipality of Pinukpuk, and Municipality of Rizal. The Municipality of Tanudan had the lowest number of household population for both men and women. (Figure 2)
Sex ratio stands at 107 males per 100 females
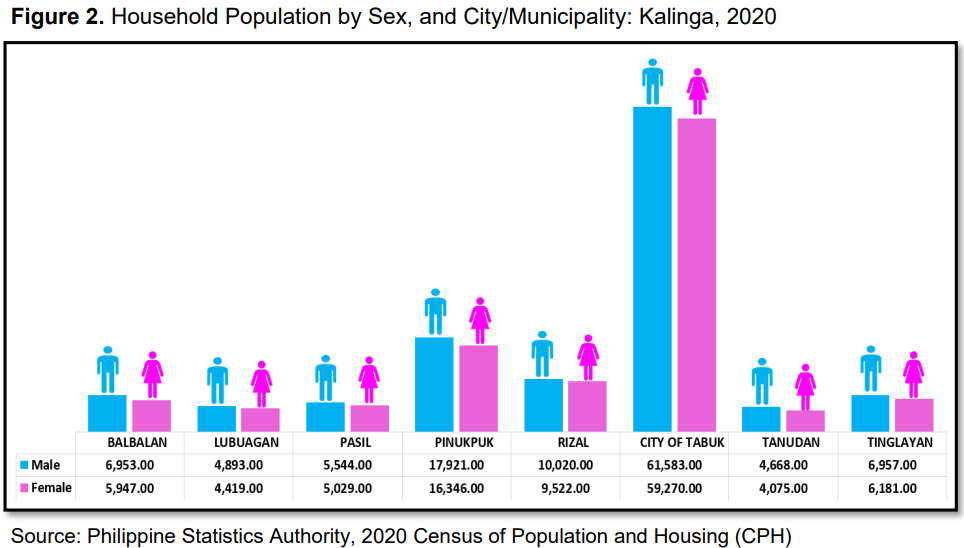
The sex ratio in the Province of Kalinga was computed at 107 in 2020. This means that there were 107 males for every 100 females. The sex ratio in 2015 was similar at 107 males per 100 females.
In 2020, children aged below 15 years had a sex ratio of 108 males per 100 females, while those aged 15 to 64 years had a sex ratio of 109 males per 100 females. Moreover, among those aged 65 years and over, the sex ratio was 86 males per 100 females. This depicts a longer life expectancy among females than males or a higher mortality rate among males than females in the older age groups. (Figure 3, Table 2)
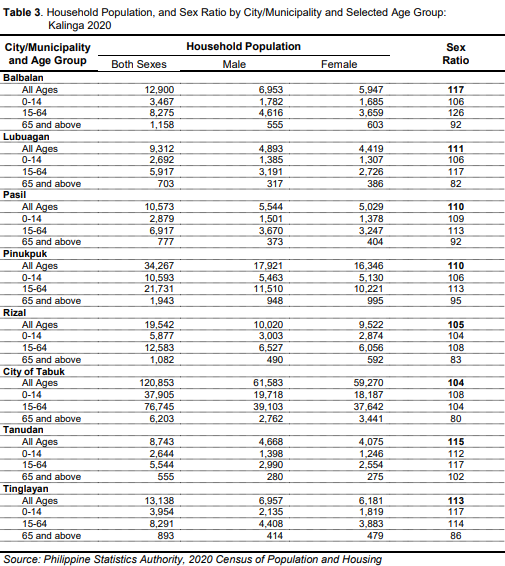
The City of Tabuk, and the Municipality of Rizal sex ratios were computed at 104 and 105 respectively, both were below the computed provincial sex ratio of 107 in 2020. The Municipality of Balbalan, on the other hand, had the highest sex ratio computed at 117. (Table 3)
For the age group 0 to 14, the Municipality of Tinglayan had the highest sex ratio at 117, while the Municipality of Rizal had the lowest ratio computed at 104. The Municipality of Balbalan recorded the highest sex ratio at 126, while the City of Tabuk had the lowest sex ratio computed at 104 for the age group 15 to 64. And for the age group 65 and above, the Municipality of Tanudan recorded the highest sex ratio at 102, while the City of Tabuk had the lowest computed sex ratio at 80. (Table 3)
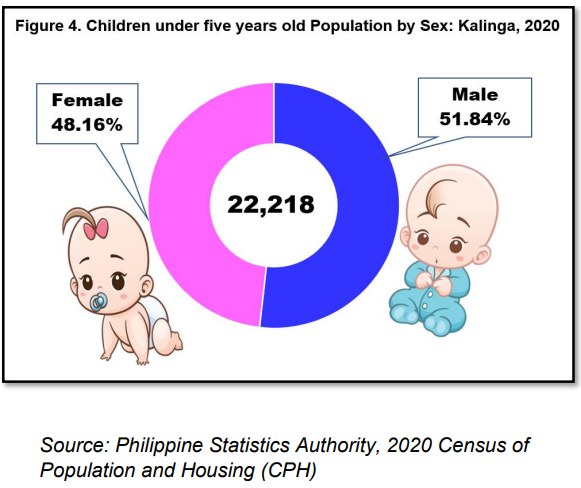
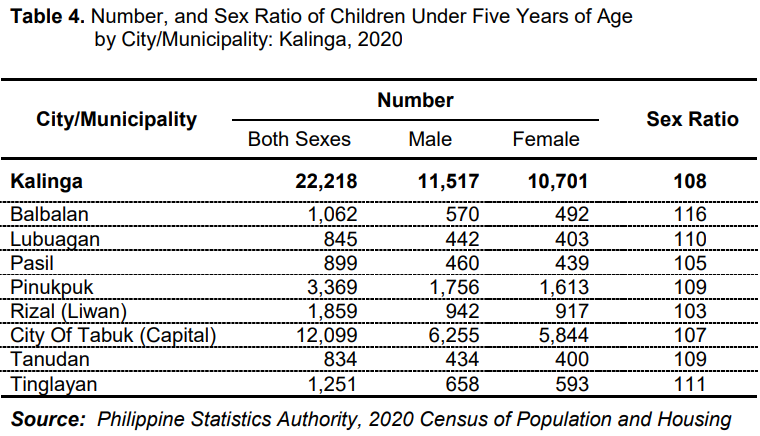
There are more males than females in children under five years old
Children below five years old comprised 9.69 percent (22,218 persons) of the Household Population, which is lower than the 10.94 percent (23,198 persons) posted in 2015. The sex ratio in 2020 and 2015 were the same and computed at 108 males per 100 females. (Table 2)
The Municipality of Rizal had the lowest sex ratio in 2020 at 103 males per 100 females. It is followed by the Municipality of Pasil, and the City of Tabuk at 105 and 107 respectively. Conversely, the Municipality of Balbalan had the highest sex ratio at 116. (Table 4)
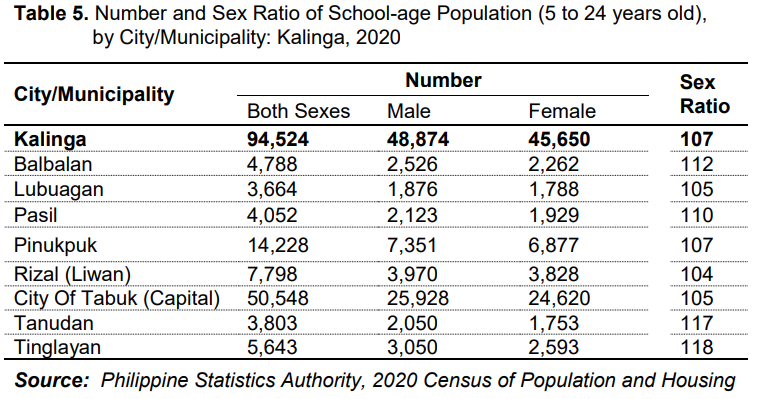
School-age population accounted for 41.21 percent of the total household population
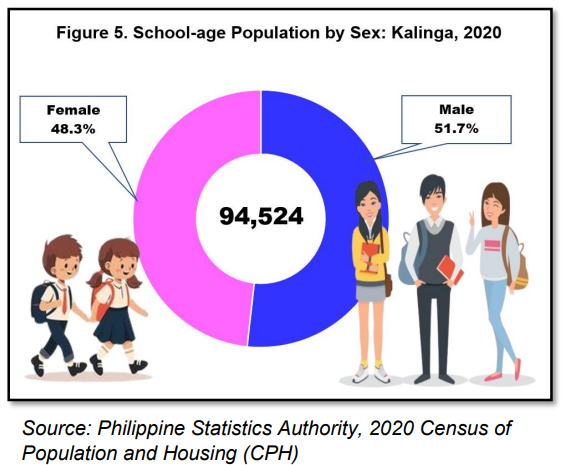
In 2020, the school-age population (5 to 24 years old) accounted for 41.22 percent (94,524 persons) of the household population of the province, down from the 42.6 percent (90,316 persons) in 2015. Of this figure, 51.7 percent or 48,874 persons were males, while the remaining 48.3 percent or 45,650 persons, were females. (Table 2 & 5, and Figure 5)
The sex ratio in 2020 for the school-age population was computed at 107 males per 100 females. The Municipality of Tinglayan, and Municipality of Tanudan posted the highest sex ratios at 118 and 117 respectively.
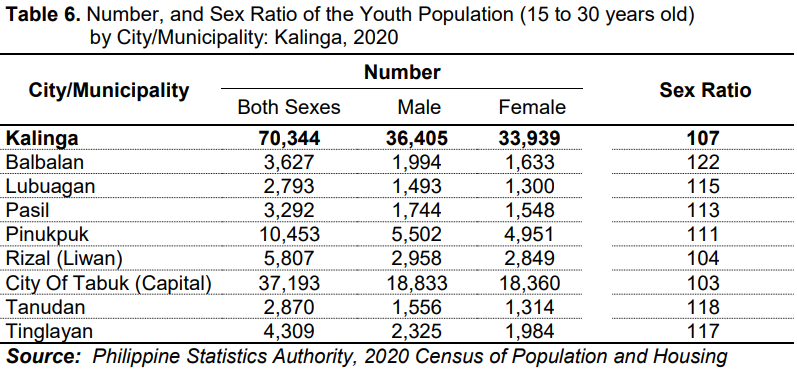
In 2020, male youth outnumbered female youth by 7.26 percent, or 2,466 persons. Male youth made up 51.75 percent (36,405 persons) and female youth made up 48.25 percent (33,939 persons) of the youth population. (Table 6 and Figure 6) Sex ratio of the youth population was computed at 107 males per 100 females for the province of Kalinga. The City of Tabuk, and the Municipality of Rizal had sex ratios below the provincial sex ratio, while the other municipalities computed sex ratios were above the provincial level. (Table 6).
More than half of the senior citizens population were female
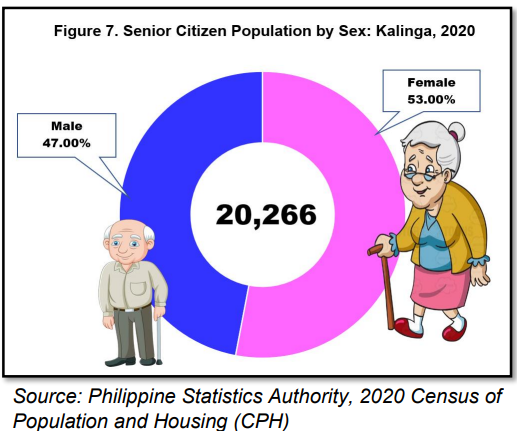
People aged 60 years old and over are regarded as senior citizens in the Philippines. In the Province of Kalinga, they accounted 8.84 percent (20,266 persons) of the Household Population in 2020, higher than the 7.73 percent (16,385 persons) recorded in 2015. There were more females (53%) than males (47%) among the senior citizens, in 2020. The same trend was observed in 2015. (Table 2 & 7 and Figure 7)
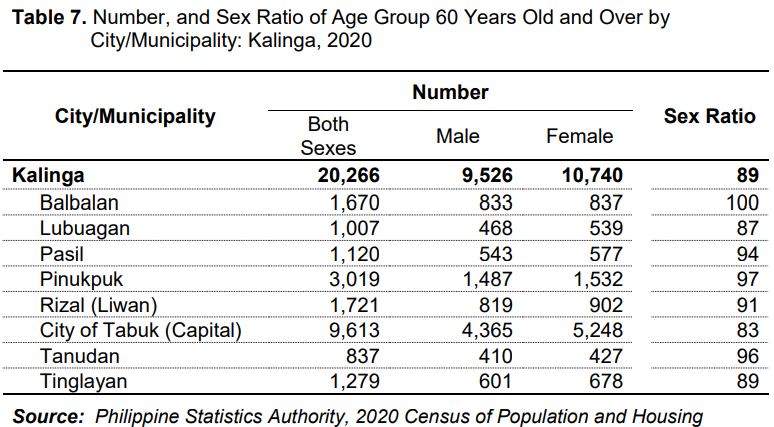
The sex ratio for the age group 60 years old over was computed at 89 males per 100 females. Below the provincial level sex ratio were, City of Tabuk at 83, and the Municipality of Lubuagan at 87. Moreover, the Municipality of Tinglayan computed sex ratio was 89, same with the province. The rest of the municipalities had sex ratios above the provincial sex ratio. (Table 7)
More than half of the working-age or economically-active population were men
Among young dependents, defined as those under the age of 15 years, there was a higher proportion of males, accounting for 51.97 percent, compared to females, who represented 48.03 percent. (Table 2 and Figure 8)
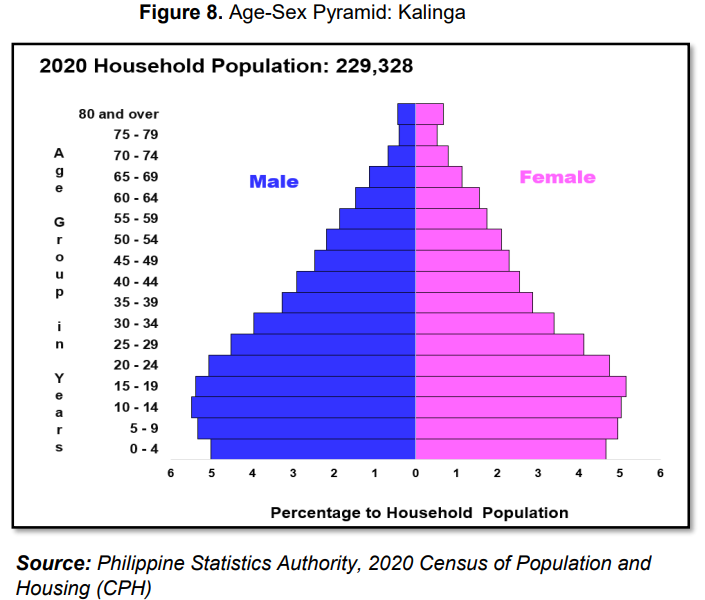
Similarly, within the working-age or economically-active population (15-64 years old), males were also predominant, constituting 52.06 percent, while females made up 47.94 percent of this demographic group. (Table 2 and Figure 8)
Conversely, among the older dependents aged 65 years and over, females outnumbered males significantly, with females comprising 53.89 percent compared to 46.11 percent males. The same trend was also observed in 2015. (Table 2)
More men were single in 2020
In 2020, Kalinga’s household population aged 10 years and over totaled 183,490 persons, in which men outnumbered the women by 6.79 percent. (Figure 9)
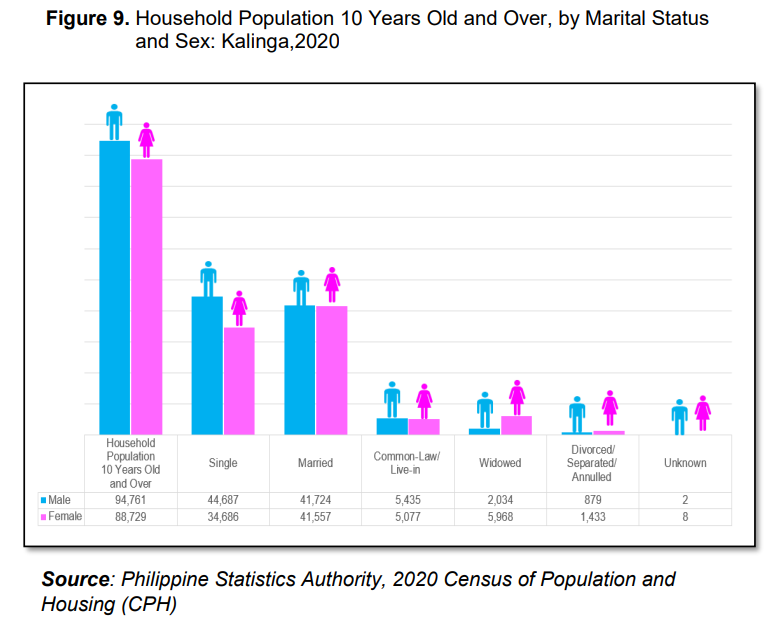
Moreover, the marital status distribution revealed notable disparities between sex. A higher proportion of males (47.16%) were single compared to females (39.09%), indicating a greater prevalence of singlehood among males. Conversely, more females (46.84%) were married than males (44.03%), demonstrating a subtle gender difference in marital status.
Moreover, there was a significant gender gap in the widowed category, with 6.73 percent of females compared to only 2.15 percent of males being widowed. However, in terms of common-law or live-in relationships, the distribution was relatively equal, with approximately 5.72 percent of females and 5.74 percent of males in this category. (Figure 9)
More men were born in 2023
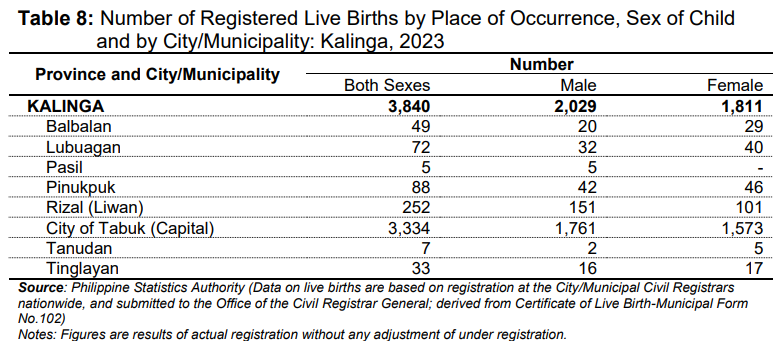
In 2023, a total of 3,840 children were born in Kalinga. Of this total, 2,029 were males, which is 12.03 percent higher than the number of females born, at 1,811. This shows a ratio of 112 males per 100 females, which means for every 100 female children born, there are 112 males. (Figure 10)
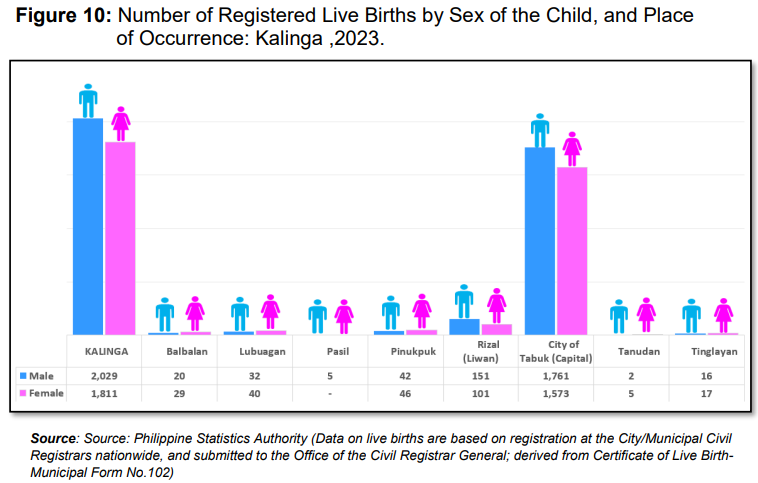
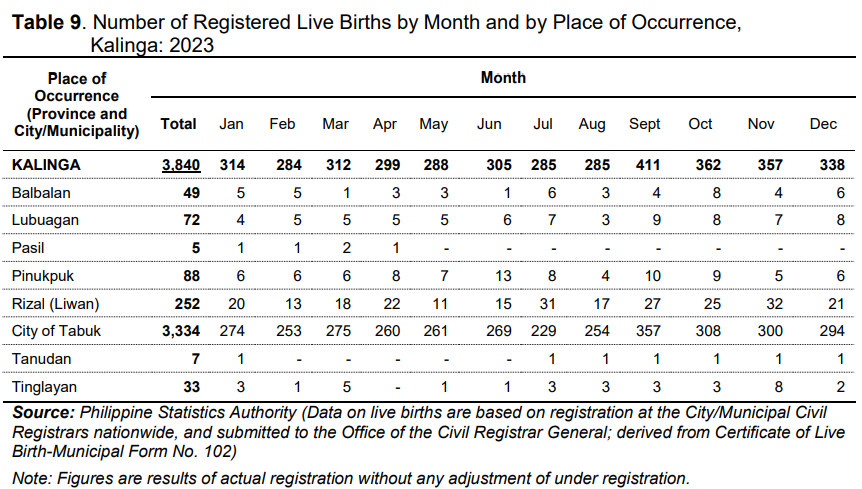
In terms of the place of occurrence, the City of Tabuk registered the highest number of births with 3,334 children. Moreover, the City of Tabuk registered the highest number of males and females born. The Municipality of Pasil, on the other hand, registered the lowest number of births with 5 male children. (Table 8)
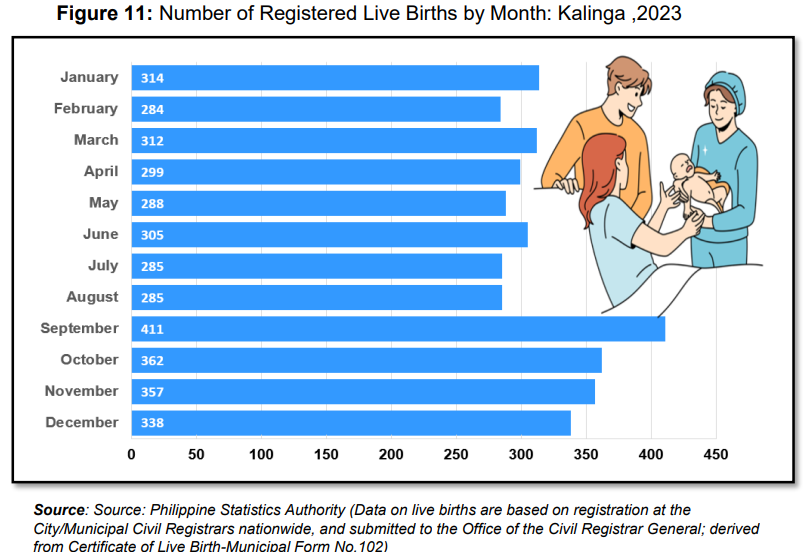
In 2023, September recorded the highest number of births, with a total of 411 children. In contrast, February had the lowest number of births, with only 284 recorded. (Figure 11)
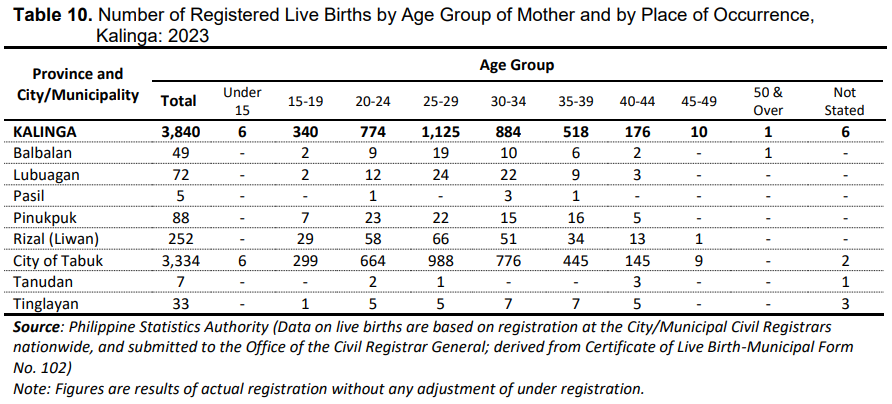
Mothers aged 25 to 29 topped the highest birth-giving statistics
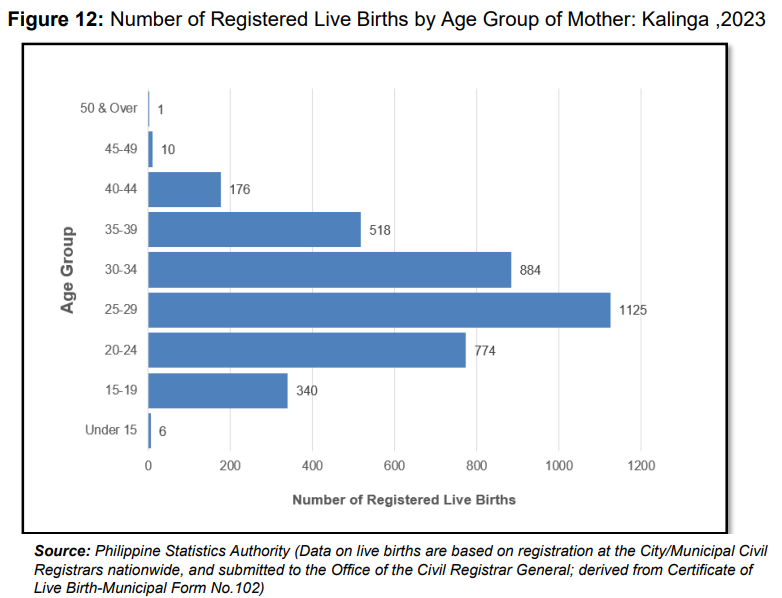
In 2023, most of the registered births were from mothers in the age group of 25-29, totaling 1,125 births, followed by 30-34 with 884 births, and 20-24 with 774 births. It is notable that there were six births recorded for mothers under 15 years old. (Figure 12)
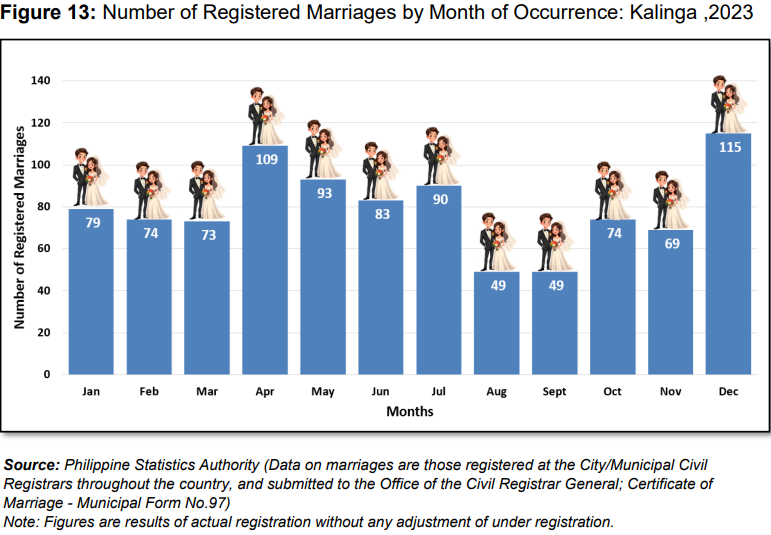
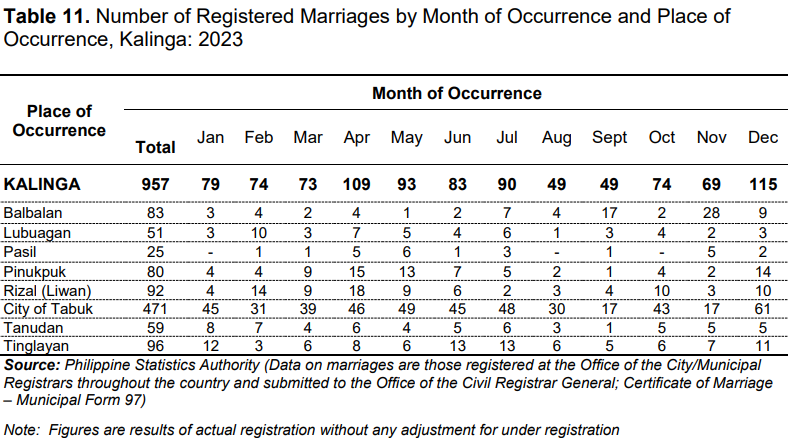
Most marriages were recorded in the month of December
In 2023, a total of 957 marriages were recorded, with the highest number occurring in December (115 marriages) and the lowest in August (49 marriages) and September (49 marriages). (Figure 13)
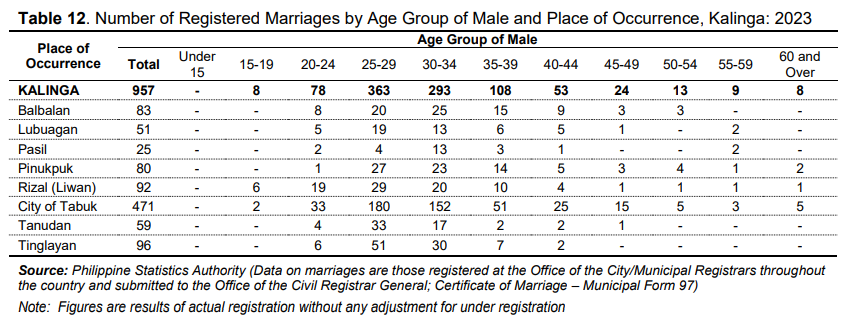
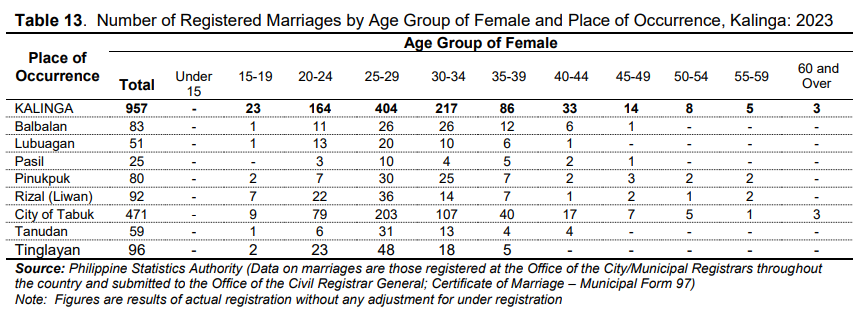
Most marriages involved individuals aged 25 to 29 years old
For men, the majority of marriages involved those aged 25-29 (363 men), while the least were in the age group 15- 19 (8 men). Interestingly, there were recorded marriages for men aged 60 years and over (18 men). (Figure 14, Table 12)
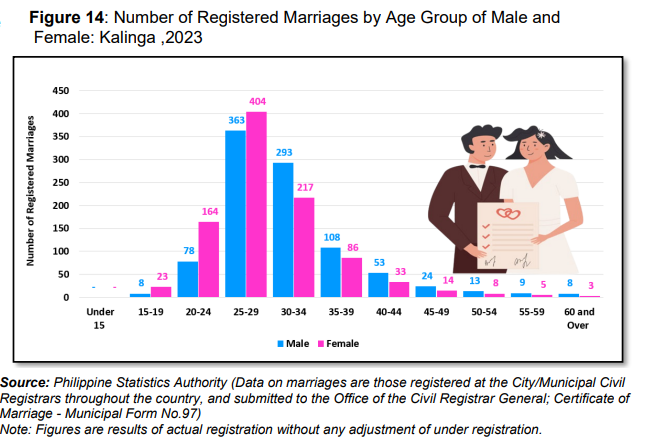
Similarly, for women, the most common age group for marriages was 25-29 (404 women), while the lowest was in the age group 60 and over (3 women). Notably, there were 23 marriages involving women aged 15-19. (Figure 14, Table 13)
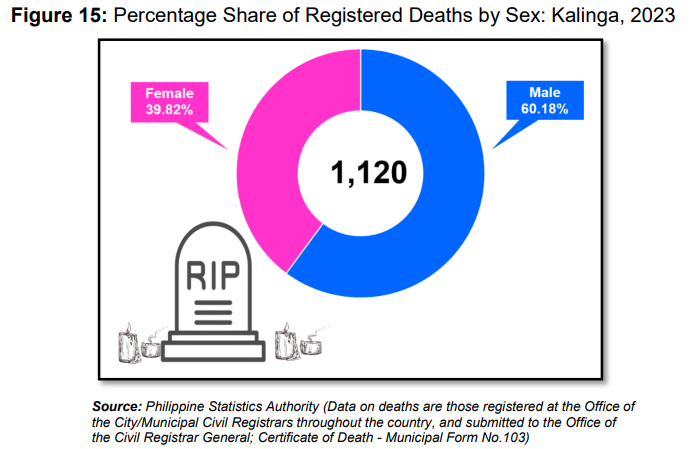
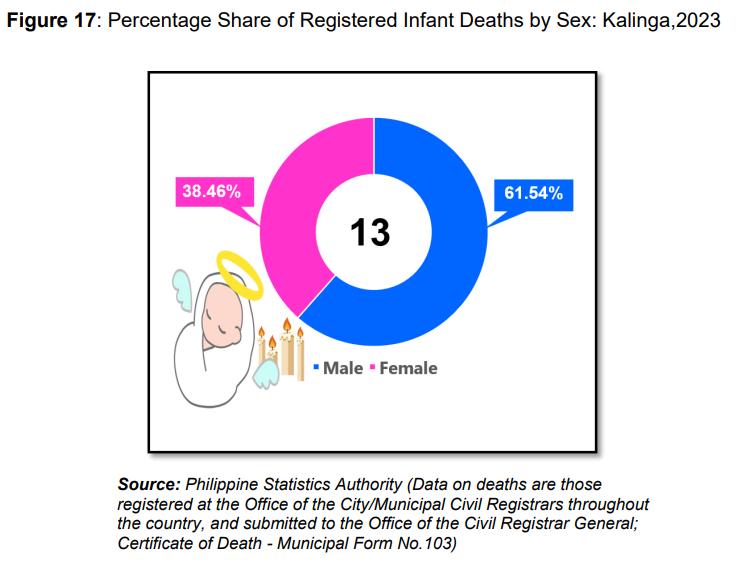
Men recorded a higher number of deaths in 2023
In Kalinga, there was a total of 1,120 deaths, including 2 maternal deaths and 13 infant deaths. Of the total number of deaths, 674 were men and 446 were women. (Figure 15)
Notably, the highest number of deaths was recorded among females aged 85 and over, while for males, the highest number was in the 70-74 age group. On the other hand, the lowest number of deaths among females was in the 1-4 age group, while for males, the lowest was in the 5-9 age group. (Figure 16)
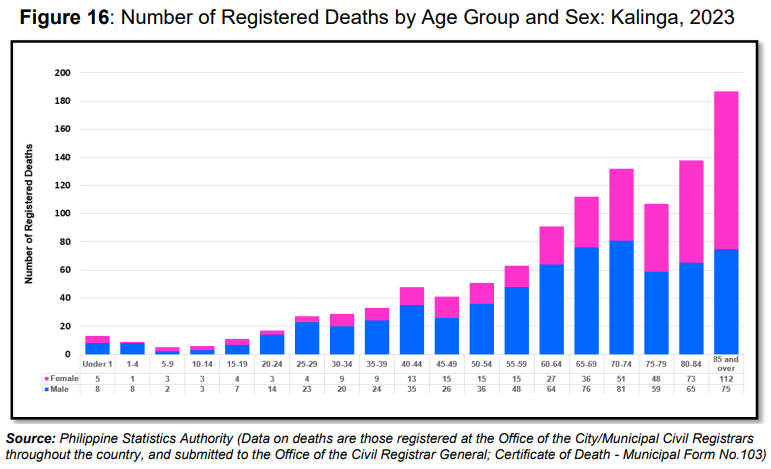
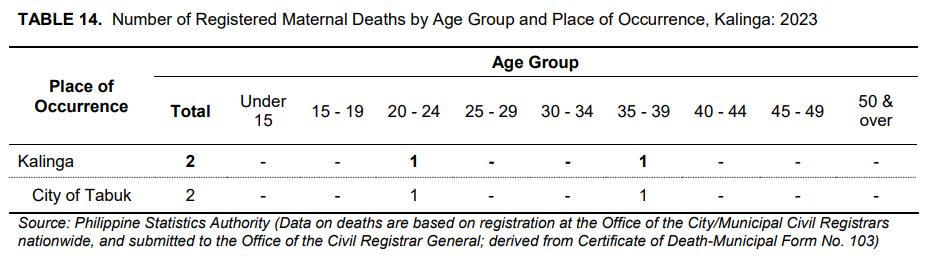
On infant deaths, there were 8 males and 5 females recorded. The recorded maternal deaths, on the other hand, occurred in the age groups 20-24 years old (1 death), and 35-39 years old (1 death), all of which were from the City of Tabuk. (Table 14 and Figure 17)
Agriculture
Agricultural Population
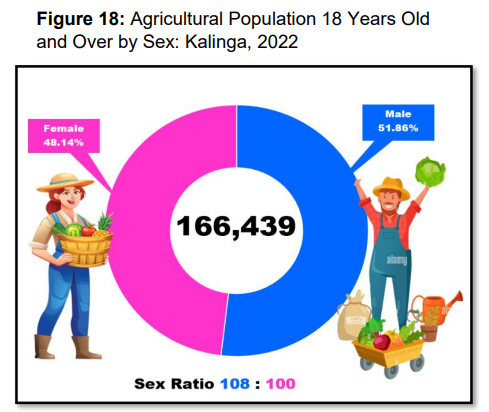
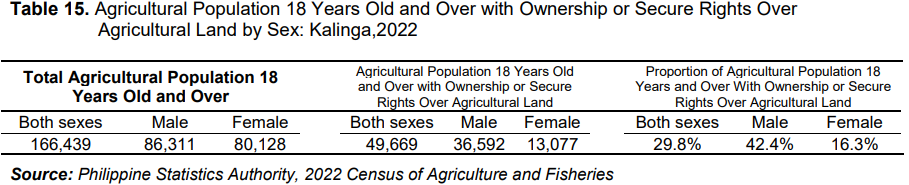
Based on the results of the 2022 Census of Agriculture and Fisheries (CAF), the total agricultural population in Kalinga was estimated at 166,439 individuals. Out of the total agricultural population, 51.86 percent were males, while 48.14 percent were females. Sex ratio was computed at 108 males per 100 females. (Figure 18 and Table 15)
Agricultural Population with Ownership or Secure Rights over Agricultural Land
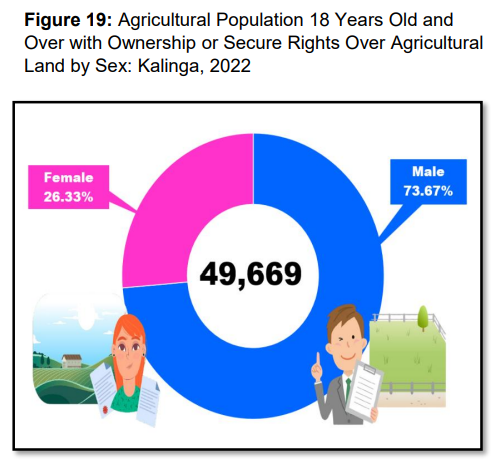
Of the total agricultural population, individuals who reported owning or having secure rights over their agricultural land accounted for 29.8 percent or 49,669 individuals. Of this individuals, 73.67 percent were males (36,592 individuals), while 26.33 percent were females (13,077 individuals). (Table 15 and Figure 19)
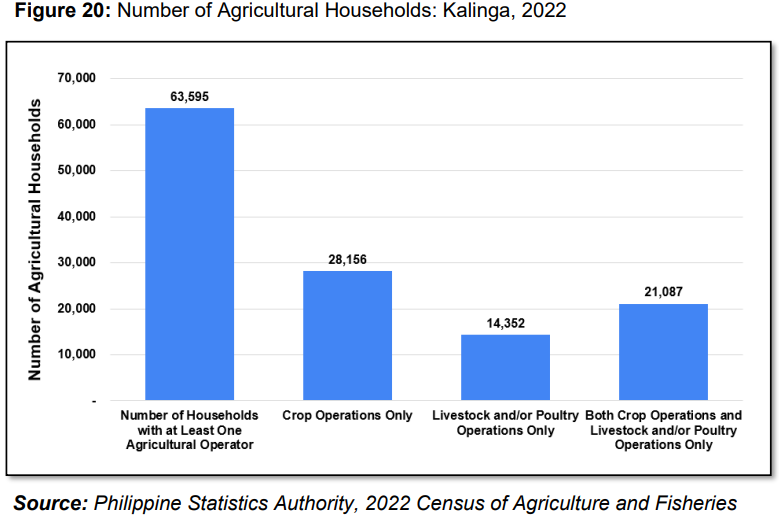
Households with Agricultural Operators
The number of Agricultural households or households with at least one agricultural operator, that is, with crop, livestock and/or poultry operators, reached 63,595 in year 2022. (Figure 20)
Among the total number of agricultural households, 28,156 (44.27%) were households with operators engaged in crop farming activities only, and 14,352 (22.57%) were households with operators engaged in livestock and/or poultry farming activities only, and 21,087 (33.16%) were households with operators engaged in both crop and livestock and poultry farming activities. (Figure 20)
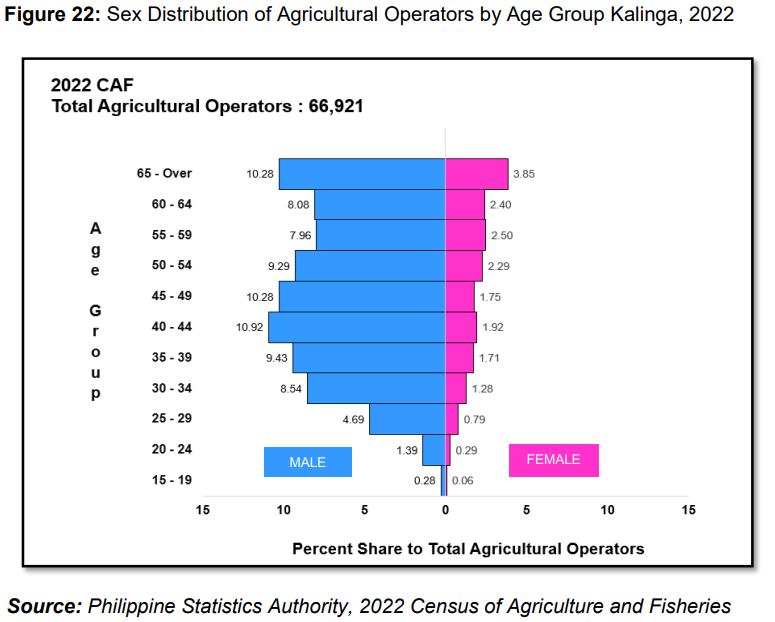
Agricultural Operators
The number of agricultural operators in the year 2022 was 66,921 individuals for the province of Kalinga. Almost half (42.9%) of the agricultural operators were engaged exclusively in crop farming (crop farm operators only), while 35.7 percent were operators of both crop farm and livestock and/or poultry farm activities. The 21.4 percent operators raised livestock and/or poultry animals only and did not have any crop farm operations. (Table 16)
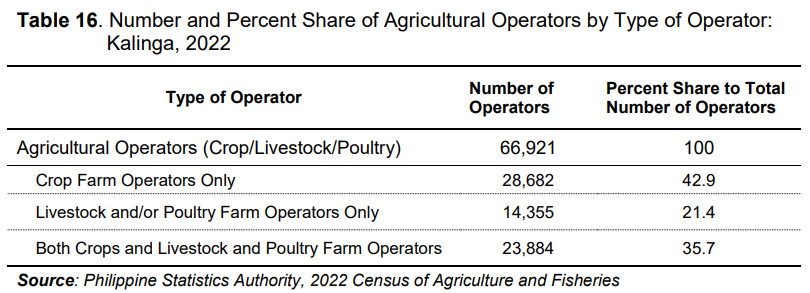
The average number of agricultural operators per agricultural household in the province of Kalinga in 2022 was 1.05 operators per household.
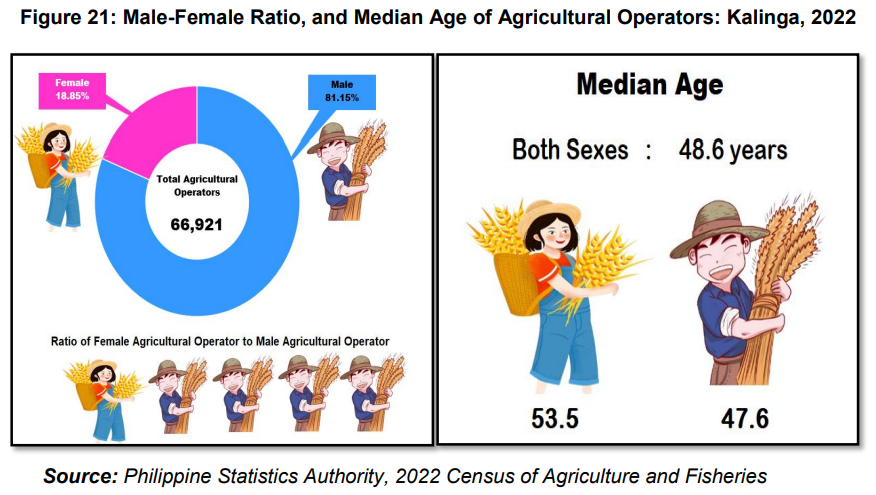
Of the total 66,921 agricultural operators in 2022, 54,308 (81.15%) were males while 12,613 (18.85%) were females. This translated into a ratio of about four male agricultural operators for every one female agricultural operator. (Figure 21)
For both sexes, the median age was 48.6 years. Female agricultural operators had a median age of 53.5 years, nearly 6 years older than their male counterparts, whose median age was 47.6 years. (Figure 21)
The proportion of agricultural operators increases with age, starting from 15 to 19 years to 40 to 44 years. Among the agricultural operators, the younger age group (15 to 29 years old) accounted for only a small proportion (7.5%) of the total agricultural operators. The middle age group (30 to 49 years) accounted for a large proportion of 45.8 percent. Moreover, the older age group (50 and above) accounted for nearly half (46.6%) of the total number of agricultural operators. In the same age group (50 and above), 14.1 percent were in the age group of 65 years and above. (Figure 22)
Election
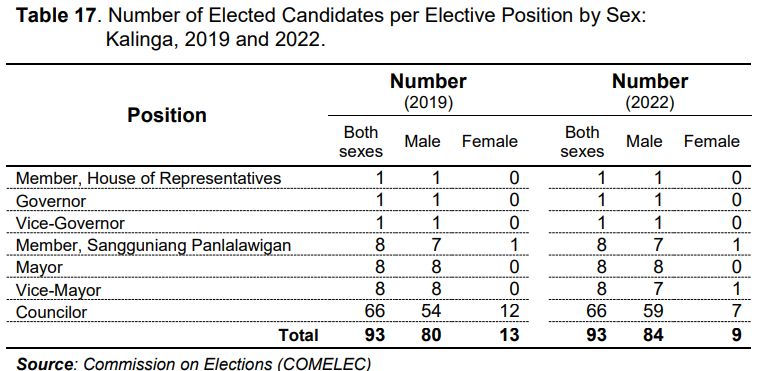
In 2022, males held 84 positions, while females held 9 positions, highlighting a notable gender gap. This pattern persisted in the 2019 election, with males dominating councilor roles. For the two election periods, male candidates consistently secured key positions such as Mayor, Governor and Member of the House of Representatives. (Figure 23, Table 17)
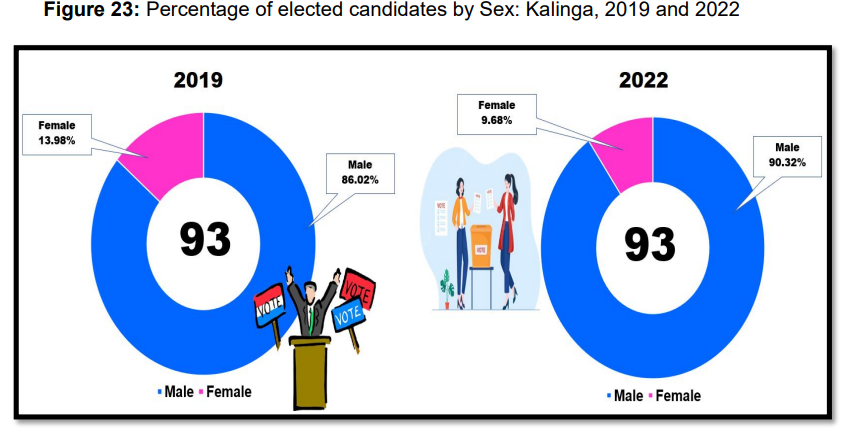
Moreover, 1 female was a Member of the Sangguniang Panlalawigan, while 12 were Councilors in the 2019 election. For the 2022 election, 1 female was a Member of the Sangguniang Panlalawigan, 1 was a Vice Mayor, and 7 were Councilors. (Table 17)
Definition of Terms and Concepts
Age refers to the interval of time between the person’s date of birth and his/her last birthday prior to the census reference date. It is expressed in completed years or whole number.
Agricultural Operator - is a civil or juridical person who/that exercises management control over the agricultural operation of a farm and takes major decisions regarding resource use. He/she has technical and economic responsibility for the farm and may undertake all responsibilities directly, that is, he/she operates the farm or delegates responsibilities related to day-to-day work management to a hired manager. Economic responsibility means major decision in using the finances in operating the farm. An agricultural operator could be the owner or tenant/lessee of the farm who is solely responsible for making the major decisions of the operation of the agricultural farm, including the management and supervision of hired labor. Meanwhile, a person hired to supervise the day-to-day activities on the farm owned by another household or by a non-household is NOT a CROP FARM OPERATOR for the 2022 CAF. He/she is called a hired manager. (2022 CAF)
- Crop Farm Operator - is solely responsible for making the technical and economic decisions and implementation of the plans involving the types of crops to be planted in relation to the type of soil in the agricultural farm, amount of water to be used in irrigating the farm, fertilizer to apply, time of planting and other farm implements, and other consequences that may result from the farm operation.
- Livestock/Poultry and/or Insect/Worm Farm Operator - is solely responsible for taking the technical and economic decisions and implementation of the plans involving the kind of livestock/poultry to raise and/or insects/worms to be cultured, type of feeds and vaccines, time of pasture in an open field and time of putting them back in a shelter, number of animals for slaughter/dressing/selling, and other consequences that may result from the farm operation.
Birth the act or process of delivering a child. It may either be a live birth or a stillbirth. (NEDA)
Civil Registration is defined as the continuous, permanent and compulsory recording of the occurrences and characteristics of vital events, primarily for their value as legal documents and secondary for their usefulness as a source of statistics.
Death refers to the permanent disappearance of all signs of life of a living person at any time. (PSA)
Death registration - registration is the permanent and official recording of a person’s death.
Infant mortality – is the death of an infant before his or her first birthday. The infant mortality rate is the number of infant deaths for every 1,000 live births.
Household is a social unit consisting of person or a group of persons who sleep in the same housing unit and have a common arrangement in the preparation and consumption of food.
Household population refers to all persons who are members of the household.
Median age is the age that divides the population into two numerically equal groups; that is, half of the population are younger than this age and the other half are older.
Marital status – status of an individual in relation to marriage, classified as follows:
- Single – refers to a person who has never married;
- Married – refers to a couple living together as husband and wife, legally or consensually;
- Divorced – refers to a person whose bond of matrimony has been dissolved legally and who therefore can remarry;
- Separated – refers to a person separated legally or not from his/her spouse because of marital discord or misunderstanding;
- Widowed – refers to a person whose bond of matrimony has been dissolved by death of his/her spouse
Maternal death – is the death of a woman while pregnant of within 42 days of termination of pregnancy, irrespective of the duration and the site of the pregnancy, from any cause related to or aggravated by the pregnancy or its management, but not from accidental or incidental causes.
Mortality rate – generally expresses the chance that death will occur during a particular period to a person in a particular population group alive at the beginning of the period. As such, those rates are true probabilities and describe precisely the risk of dying for any actual cohort. (NEDA)
Sex is the biological and physiological reality of being a male or female.
Sex ratio is the number of males per one hundred females in a population.
sgd.
MARIBEL M. DALAYDAY
