

The Philippine Statistics Authority (PSA) generates production-related statistics on crops other than palay and corn through the Crops Production Survey (CrPS). This is a quarterly survey that aims to generate basic production statistics for crops at the national and sub-national levels. Nineteen major crops under the Other Crops sub-sector are highlighted in the Performance of Philippine Agriculture Report (PAR). It covers more than 280 crops sub-classified under three commodity groupings, namely: 1) Non-Food and Industrial Crops (NFICs), 2) Fruit Crops, and 3) Vegetables. The commodity coverage by province differs and depends on what each province produces. After the collection and organization of statistics on Other Crops, these undergo review and validation process before finally made available to data users.
Table 1. Major and Priority Vegetables Production by Province, CAR: CY 2019
| Region/Province | Production (MT) | % Change | |
| 2018 | 2019 | ||
| CAR | 368,670.0 | 368,608.2 | (0.02) |
| Major | 131,579.9 | 129,516.7 | (1.57) |
| Priority | 237,090.1 | 239,091.46 | 0.84 |
| Abra | 5,861.2 | 5,863.2 | 0.03 |
| Major | 1,903.0 | 1,890.6 | (0.65) |
| Priority | 3,958.2 | 3,972.64 | 0.36 |
| Apayao | 13,267.7 | 13,985.3 | 5.41 |
| Major | 12,107.7 | 12,698.9 | 4.88 |
| Priority | 1,160.0 | 1,286.41 | 10.90 |
| Benguet | 297,019.2 | 308,218.6 | 3.77 |
| Major | 87,034.8 | 94,261.6 | 8.30 |
| Priority | 209,984.4 | 213,957.0 | 1.89 |
| Ifugao | 18,339.8 | 8,130.8 | (55.67) |
| Major | 15,062.0 | 5,358.4 | (64.42) |
| Priority | 3,277.8 | 2,772.41 | (15.42) |
| Kalinga | 1,005.2 | 959.6 | (4.54) |
| Major | 462.1 | 341.8 | (26.05) |
| Priority | 543.1 | 617.80 | 13.76 |
| Mountain Province | 33,176.9 | 31,140.6 | (6.14) |
| Major | 15,010.3 | 14,965.6 | (0.30) |
| Priority | 18,166.6 | 16,175.06 | (10.96) |
- The vegetables production of the Cordillera Administrative Region (CAR) slightly decreased by 0.02% from 368,670.0 MT in 2018 to 368,608.2 MT in 2019. Ifugao, Kalinga and Mt. Province registered negative performances while, Abra, Apayao and Benguet increased production (Table 1).
Table 2. Distribution of Total Vegetables Production by Province, CAR: CY 2019
| Region/Province | Production (MT) | % to Total |
| CAR | 368,608.2 | 100.0 |
| Major | 129,516.7 | 35.1 |
| Priority | 239,091.5 | 64.9 |
| Abra | 5,863.2 | 1.6 |
| Major | 1,890.6 | 0.5 |
| Priority | 3,972.6 | 1.1 |
| Apayao | 13,985.3 | 3.8 |
| Major | 12,698.9 | 3.4 |
| Priority | 1,286.4 | 0.3 |
| Benguet | 308,218.6 | 83.6 |
| Major | 94,261.6 | 25.6 |
| Priority | 213,957.0 | 58.0 |
| Ifugao | 8,130.8 | 2.2 |
| Major | 5,358.4 | 1.5 |
| Priority | 2,772.4 | 0.8 |
| Kalinga | 959.6 | 0.3 |
| Major | 341.8 | 0.1 |
| Priority | 617.8 | 0.2 |
| Mountain Province | 31,140.6 | 8.4 |
| Major | 14,965.6 | 4.1 |
| Priority | 16,175.1 | 4.4 |
- In 2019, 239,091.5 MT (64.9%) out of the total regional production of 368,608.2 MT were contributed by priority vegetables and 129,516.7 MT (35.1%) came from major vegetables (Table 2).
-
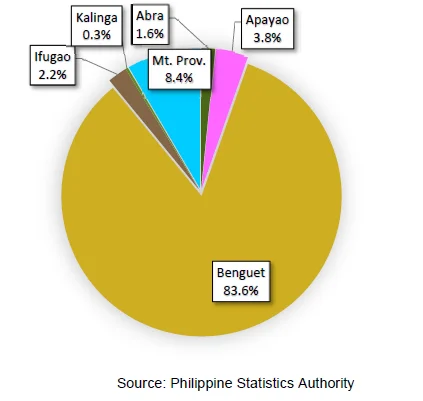
Benguet was the top producer with 308,218.6 MT with a share of 83.6% of the total regional vegetables production. Mountain Province came second with 8.4% share, followed by Apayao with 3.8%, Ifugao with 2.2%, and Abra with 1.6% share respectively (Figure 1).
-
Kalinga contributed the smallest share in the total vegetables production of the region with an output of 959.6 MT comprising 0.3% of the total vegetables production in the region (Table 2).
Figure 1. Percentage Distribution of Total Vegetable Production in CAR, CY 2019
Major Vegetable Crops
- The commodities comprising the major vegetables are Mongo, Peanut, Cabbage, Eggplant, Tomato, Garlic, Camote and Cassava.
-
Cordillera major vegetables output during the CY 2019 was 129,516.7 MT, comprising 64.9 % of the total vegetables production in the region (Table 3).
Table 3. Major Vegetables Production by Province, CAR: CY 2019
| Region/Province | Production (MT) | % Share |
| CAR | 129,516.7 | 100 |
| Abra | 1,890.6 | 1.5 |
| Apayao | 12,698.9 | 9.8 |
| Benguet | 94,261.6 | 72.8 |
| Ifugao | 5,358.4 | 4.1 |
| Kalinga | 341.8 | 0.3 |
| Mountain Province | 14,965.6 | 11.6 |
Figure 2. Percentage Distribution of Major Vegetables Production in
CAR: CY 2019
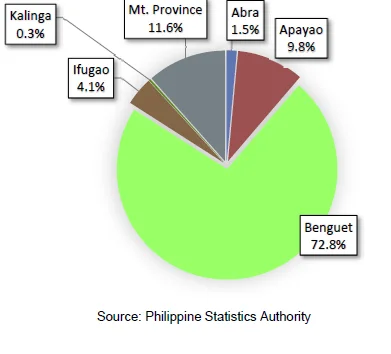
- Benguet was the top major vegetables producing province with 94,261.6 MT comprising 72.8% of the total major vegetables production. Mt. Province followed with 11.6 % share. Apayao and Ifugao came third and fourth with 9.8% and 4.1% shares. The provinces with the smallest shares were Abra and Kalinga with 1.5% and 0.3 % shares, respectively (Figure 2).
Table 4. Vegetables Production and Area Harvested by Province, CAR: CY 2019
| Region/Province | Production (MT) | Area Harvested (Has) |
| CAR | 368,608.2 | 23,976.9 |
| Abra | 5,863.2 | 636.0 |
| Apayao | 13,985.3 | 714.5 |
| Benguet | 308,218.6 | 17,581.0 |
| Ifugao | 8,130.8 | 1,759.1 |
| Kalinga | 959.6 | 230.5 |
| Mountain Province | 31,140.6 | 3,055.8 |
- In 2019, CAR total vegetables production registered at 368,608.2 MT with an estimated area harvested of 23,976.9 hectares. Priority vegetables dominated the region’s production accounting for 64.9% of the total vegetables production (Table 4).
-
Benguet province posted the highest vegetables production with 308,218.6 MT from an area harvested of 17,581.0 hectares. Mt. Province came second with 31,140.6 MT with an area harvested of 3,055.8 hectares while Kalinga had the least production in the region with 959.6 MT and an area harvested of 230.5 hectares (Table 4).
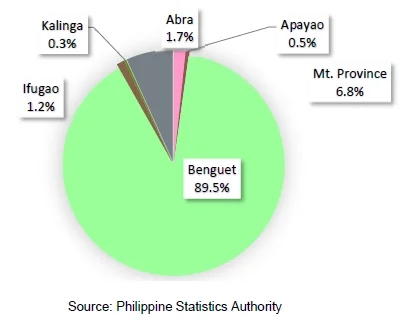
Figure 3. Percentage Distribution of Priority Fruits
production in CAR, CY 2019
Priority Vegetable Crops
- Priority vegetables include Habitchuelas, Banana blossom, Broccoli, Cauliflower, Kangkong, Lettuce, Pechay, Ampalaya fruit, Stringbeans, Gourd, Okra, Squash fruit, Ginger, Pepper, Carrots, Gabi, Radish and White potato.
-
In terms of percentage distribution in priority fruits production in the region, Benguet contributed 89.5%. Mt. Province came second with 6.8% share. The other provinces and their shares to total priority vegetables production were Abra with 1.7 %; Ifugao with 1.2%; and Apayao with 0.5 %. Kalinga province had the smallest share of 0.3 percent (Figure 3).
