RICE HOUSEHOLD STOCKS INVENTORY
CAR rice household stocks estimated at 60 thousand metric tons in 2019
- The rice household stocks inventory of the Philippines as of December 1, 2019 was recorded at 1,607,635 metric tons. This increased by 5.1 percent compared to the record in the same month in 2018 with 1,528,972 metric tons.
- In the Cordillera region, the rice household stocks inventory was estimated at 60,512 metric tons as of December 1, 2019. This contributed 3.8 percent to the national rice household stocks inventory and increased by 4.4 percent from 57,985 metric tons in December 2018.
- Rice household stocks in the province of Abra, Benguet and Apayao showed an increasing trend that mainly contributed to the increase of the regional rice household stocks. Apayao recorded the largest increase of rice household stocks by 40.4 percent. On the other hand, rice household stocks in the province of Ifugao, Kalinga and Mt. Province showed a decreasing trend.
Table 1. Rice Household Stocks Inventory by Province, CAR: As of December 1, 2018 & 2019
| Region/Province | Rice Household Stocks (in metric tons) | % Change | |
|---|---|---|---|
| December 1, 2018 | December 1, 2019 | ||
| PHILIPPINES | 1,528,972 | 1,607,635 | 5.1 |
| CAR | 57,985 | 60,512 | 4.4 |
| Abra | 12,387 | 16,303 | 31.6 |
| Benguet | 12,512 | 15,465 | 23.6 |
| Ifugao | 7,451 | 7,199 | (3.4) |
| Kalinga | 14,115 | 9,429 | (33.2) |
| Apayao | 5,851 | 8,215 | 40.4 |
| Mt. Province | 5,669 | 3,901 | (31.2) |
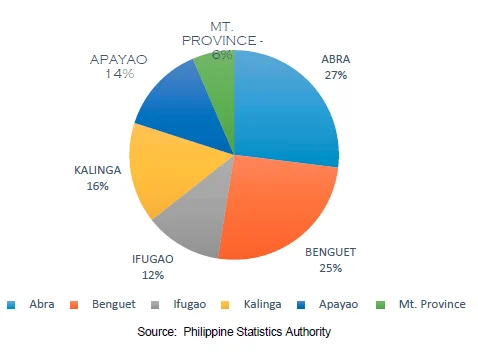
Abra has the biggest share to the regional rice stocks
- The rice household stocks in the province of Abra was estimated at 16,303 metric tons which gave the biggest share of 27 percent to the regional rice household stocks inventory. This was followed by the province of Benguet with 15,465 metric tons contributing 26 percent to the regional stocks.
- Mt. Province had the least rice household stocks with 6 percent (3,901 metric tons).
Figure 1. Percentage Distribution of Rice Household Stocks Inventory by Province, CAR:
As of December 1, 2019
Monthly average rice household stocks is about 42 thousand metric tons
- In 2019, the monthly average rice household stocks in the Cordillera was estimated at 42,107 metric tons. The biggest rice household stocks were recorded during the month of January with 61,357 metric tons, followed by the month of December with 60,512 metric tons and the month of February with 50,460 metric tons. The month of September had the smallest rice household stocks with the record of 26,048 metric tons.
- Meanwhile in 2018, the biggest rice household stocks recorded was during the month of December with 57,985 metric tons followed by the month of February with 54,815 metric tons. The smallest rice household stocks recorded was during the month of April with 34,252 metric tons.
- Rice household stocks during the month of September declined the most with 34.8 percent decrease, followed by the months of August with 23.9 percent and March with 21.8 percent. On the other hand, rice household stocks during the month of April had the highest increase with 19.4 percent followed by the month of January with 17.2
percent.
Table 2. Monthly Rice Household Stocks Inventory in CAR: 2018 and 2019
| MONTH | Year | % Change | |
|---|---|---|---|
| 2018 | 2019 | ||
| Jan | 52,350 | 61,357 | 17.2 |
| Feb | 54,815 | 50,460 | (7.9) |
| Mar | 43,679 | 34,145 | (21.8) |
| Apr | 34,252 | 40,900 | 19.4 |
| May | 38,005 | 39,382 | 3.6 |
| Jun | 35,498 | 36,275 | 2.2 |
| Jul | 42,426 | 35,854 | (15.5) |
| Aug | 42,900 | 32,631 | (23.9) |
| Sep | 39,963 | 26,048 | (34.8) |
| Oct | 41,307 | 41,142 | (0.4) |
| Nov | 50,730 | 46,576 | (8.2) |
| Dec | 57,985 | 60,512 | 4.4 |
CORN HOUSEHOLD STOCKS INVENTORY
2019 regional corn household stocks increased by 136%
- The corn household stocks inventory in the Philippines as of December 1, 2019 was estimated at 182,281 metric tons. This was an increase of 89.7 percent from the previous year stocks of 96,099 metric tons.
- The corn household stocks inventory in the Cordillera region estimated at 2,614 metric tons as of December 1, 2019 shared 1.4 percent to the national corn stocks. Comparing to the corn stocks in 2018 with an estimate of 1,106 metric tons, it increased by 136.3 percent. This also showed that the corn household stocks recorded as of December 1, 2019 was 2.4 times more than the corn stocks estimated in December 1, 2018.
- Corn household stocks in the provinces of Ifugao and Benguet showed an increasing trend. However, Ifugao mainly contributed to the increase of the regional corn household stocks with 315.6 percent increase. On the other hand, corn household stocks in the province of Apayao, Kalinga and Mt. Province showed a decreasing trend. Mt. Province recorded the largest decrease of corn household stocks by 98.4 percent while the province of Ifugao had the largest.
Table 3. Corn Household Stocks Inventory by Province, CAR: As of December 1, 2018 & 2019
| Region/Province | Corn Stocks (in metric tons) | % Change | |
|---|---|---|---|
| December 1, 2018 | December 1, 2019 | ||
| PHILIPPINES | 96,099 | 182,281 | 89.7 |
| CAR | 1,106 | 2,614 | 136.3 |
| Abra | - | - | - |
| Benguet | 209 | 213 | 1.9 |
| Ifugao | 550 | 2,286 | 315.6 |
| Kalinga | 120 | 88 | (26.7) |
| Apayao | 166 | 26 | (84.3) |
| Mt. Province | 61 | 1 | (98.4) |
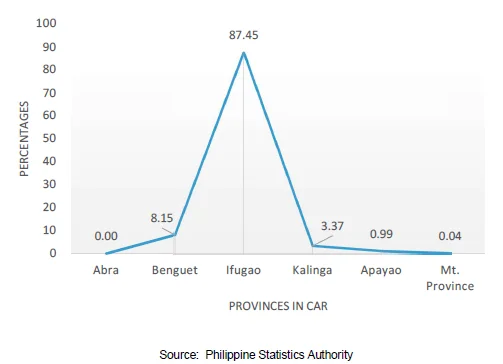
Ifugao shares almost 90% to regional corn stocks
- The province of Ifugao had the biggest share of 87.5 percent to the regional corn stocks as of December 1, 2019 with an estimate of 2,286 metric tons. The data also showed that the estimated corn household stock in 2019 was 4.2 times more than the recorded corn household stocks in December 1, 2018 at 550 metric tons.
Figure 2. Percentage Distribution of Corn Household Stocks Inventory by Province, CAR:
As of December 1, 2019
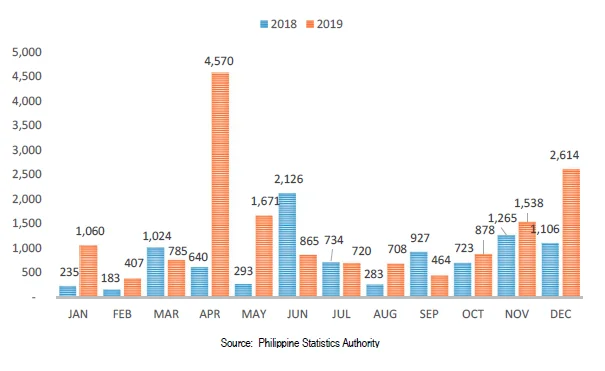
Monthly average corn household stocks is 1,357 metric tons
- In 2019, the monthly average corn household stocks in the Cordillera region was estimated at 1,357 metric tons. The biggest corn household stocks recorded was during the month of April with 4,570 metric tons followed by the month of December with 2,614 metric tons. The smallest corn household stocks estimated was during the month of February with 407 metric tons.
- In 2018, the biggest corn household stocks recorded was during the month of June with 2,126 metric tons while the month of February had the smallest corn stocks with 183 metric tons. Monthly average corn household stocks inventory was estimated at 795 metric tons.
- Monthly corn household stocks increased during most months of 2019. The percentage change during the month of April showed the highest increased rate by 614.1 percent followed by the months of May and January with 470.3 percent and 351.1 percent, respectively.
- On the other hand, corn household stocks during the months of June and September decreased by 59.3 percent and 49.9 percent, respectively.
Figure 3. Monthly Corn Household Stocks Inventory in CAR: 2018 and 2019