

Production
- In 2017, the Philippines produced 19,276,347 metric mons (MT) of palay, harvested from a total area of 4,811,808 hectares (ha). The production increased by 9.4 percent (1,649,102 MT) compared to last year’s 17,627,245 MT.
-
Central Luzon remained the top producer of palay among the regions, contributing the biggest share at 18.9 percent, followed by Cagayan Valley at 13.8 percent, and Western Visayas at 11.6 percent. On the other hand, Central Visayas produced the least at 1.7 percent, followed by CALABARZON at 2.1 percent, and Davao Region at 2.2 percent.
Table 1. Palay Production by Region, Philippines: 2017
| Region | Production (MT) |
% share to national
|
|---|---|---|
| PHILIPPINES | 19,276,347 | 100.00 |
| CAR | 445,006 | 2.3 |
| ILOCOS REGION | 1,872,052 | 9.7 |
| CAGAYAN VALLEY | 2,656,979 | 13.8 |
| CENTRAL LUZON | 3,634,807 | 18.9 |
| CALABARZON | 410,833 | 2.1 |
| MIMAROPA | 1,159,830 | 6.0 |
| BICOL REGION | 1,335,077 | 6.9 |
| WESTERN VISAYAS | 2,230,837 | 11.6 |
| CENTRAL VISAYAS | 325,209 | 1.7 |
| EASTERN VISAYAS | 945, 565 | 1.7 |
| ZAMBOANGA PENINSULA | 700, 590 | 3.6 |
| NORTHERN MINDANAO | 745, 733 | 3.9 |
| DAVAO REGION | 433,665 | 2.2 |
| SOCCSKSARGEN | 1,319,505 | 6.8 |
| CARAGA | 482,675 | 2.5 |
| ARMM | 577,984 | 3.0 |
- The Cordillera Administrative Region (CAR) ranked 13th with 445,006 MT (2.3 percent share in the national palay production) harvested from a total area of 115,555 hectares. The average yield was at 11.3 MT/Ha.
Table 2. Palay Production by Ecosystem, CAR: 2016-2017 (in metric tons)
| Region | YEAR | % share to total production | % change, 2016 vs. 2017 | |
|---|---|---|---|---|
| 2016 | 2017 | |||
| Total Production | 382,848 | 445,006 | 100 | 16.2 |
| Irrigated | 334,494 | 389,558 | 87.5 | 16.5 |
| Rainfed | 38,631 | 42,785 | 9.6 | 10.8 |
| Upland | 9,723 | 12,663 | 2.8 | 30.2 |
- Palay production of the Cordillera increased by 16.2 percent compared to last year’s production output of 382,848 MT.
-
Production from all types of palay ecosystem increased: irrigated palay increased by 16.5 percent (55,064 MT), rainfed palay by 10.8 percent (4,154 MT), and upland palay by 30.2 percent (2,940 MT).
-
As to production by ecosystem, irrigated palay had the highest production at 87.5 percent, followed by rainfed palay at 9.6 percent, and upland palay at 2.8 percent.
Figure 1. Percentage Distribution of Palay Production
by Province, CAR: 2017
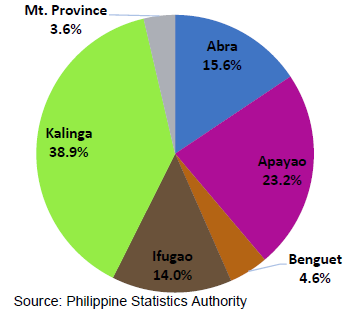
- Among provinces, the biggest share to the total regional production was contributed by Kalinga with 38.9 percent share (173,292 MT), followed by Apayao with 23.2 percent (103,335 MT), and Abra with 15.6 percent (69,477 MT). On the other hand, Mountain Province produced the least with 3.6 percent (16,239 MT).
Harvested Area
- In 2017, a total of 115,555 Ha harvested area was recorded in the Cordillera, an increase of 4.4 percent (4,915 Ha) from 100,640 Ha in 2016. The same increasing trend was observed for all types of palay ecosystem.
-
Irrigated areas accounted for 79.8 percent of the total harvested area, followed by the rainfed areas at 13.8 percent, and upland areas at 6.4 percent.
Table 3. Palay Harvested Area by Ecosystem,
CAR: CY 2016-2017 (in hectares)
| Item | YEAR | % share to total area | % change, 2016 vs. 2017 | |
|---|---|---|---|---|
| 2016 | 2017 | |||
| Total harvested area | 110,640 | 115,555 | 100 | 4.4 |
| Irrigated | 88,006 | 92,205 | 79.8 | 4.8 |
| Rainfed | 15,964 | 15, 972 | 13.8 | 0.1 |
| Upland | 6,670 | 7,378 | 6.4 | 10.6 |
Figure 2. Map Distribution of Palay Harvested Area by Province,
CAR: CY 2017

-
Among provinces, Kalinga had the largest harvested area with 31.1 percent share (35,913 Ha), followed by Apayao at 22.7 percent (26,245 Ha), and Abra with 20.8 percent (24,014 Ha). Meanwhile, Mountain Province had the smallest harvested area with 4.5 percent (5,159 Ha).
Yield
Table 3. Palay Yield (MT/Ha) by Ecosystem, CAR: 2016-2017
| Item | YEAR | % change, 2016 vs. 2017 | |
|---|---|---|---|
| 2016 | 2017 | ||
| Average yield | 3.46 | 3.85 | 11.3 |
| Irrigated | 3.80 | 4.22 | 11.1 |
| Rainfed | 2.42 | 2.68 | 10.7 |
| Upland | 1.46 | 1.72 | 17.8 |
- The average yield of palay in CAR was 3.85 MT/Ha in 2017, the highest yield recorded from 1987 to 2017.
-
Compared to the yield in 2016, it increased by 11.3 percent. Yield of irrigated palay increased by 11.1 percent, rainfed palay by 10.7 percent, and upland palay by 17.8 percent.
Figure 3. Palay Yield (MT/Ha) by Province, CAR: 2017
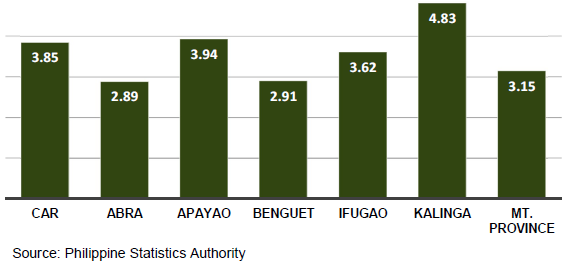
- Among ecosystem, Irrigated palay posted the highest yield with 4.22 MT/Ha while upland palay yielded the lowest with 1.72 MT/Ha.
-
By province, Kalinga posted the highest yield with 4.83 MT/Ha, followed by Apayao with 3.94 MT/Ha, and Ifugao with 3.62 MT/Ha. On the other hand, Abra posted the lowest yield with 2.89 MT/Ha.
Technical Notes
Irrigated - area with irrigation facilities supplying water through artificial means like gravity, force/power, pump, etc. Irrigated area become rainfed only, when the irrigation system is no longer operational for the past two (2) years and beyond repair and there is no plan of irrigating the farm.
Rainfed - area holds standing water but solely dependent on rainfall for its water supply. It may have dikes that retain rainwater.
Upland - farm land which has no amenities to hold for standing water. It is usually located along elevated lands, along rivers, between hills, hillsides, etc. Though crops planted in this type of ecosystem are drought-resistant and do not require standing water for their normal growth, irrigation by flushing is sometimes practiced to improve the crops’ performance especially during the long dry spell.
Yield - is an indicator of productivity derived by dividing total production by the area harvested.
Production - quantity produced and actually harvested during the reference period, includes those harvested but damaged, stolen, given away, consumed, given as harvester’s share, reserved etc.
Area harvested - actual area from which harvests are realized.
