

CAR rice household stocks estimated at 58 thousand metric tons
- As of 1 December 2018, the Philippines rice household stocks inventory was recorded at 1,527,174 metric tons (MT), this decreased by 6.7 percent as compared to the 1,636,526 MT of same month last year.
- In the Cordillera region, the household stocks inventory was estimated at 57,985 MT comprising 3.8 percent of the national household stocks. This was 0.3 percent lower than the 58,174 MT estimated in 2017.
Table 1. Rice Household Stocks Inventory by Province, CAR:
As of December 1, 2017 & 2018
| Region/Province | Rice Stock (MT) | % Change 2017 & 2018 |
|
|---|---|---|---|
| December 1, 2017 | December 1, 2018 | ||
| PHILIPPINES | 1,636,526 | 1,527,174 | (6.7) |
| CAR | 58,174 | 57,985 | (0.3) |
| Abra | 11,963 | 12,387 | 3.5 |
| Benguet | 14,392 | 12,512 | (13.1) |
| Ifugao | 7,348 | 7,451 | 1.4 |
| Kalinga | 7,007 | 14,115 | 101.4 |
| Apayao | 10,207 | 5,851 | (42.7) |
| Mt. Province | 7,257 | 5,669 | (21.9) |
Source: Philippine Statistics Authority
- Household stocks in the provinces of Benguet, Apayao and Mt. Province showed a decreasing trend that contributed the decrease of the regional stocks. On the other hand, household stocks in the provinces of Abra, Ifugao and Kalinga showed an increasing trend. Kalinga recorded the biggest increase of 101.4 percent.
Kalinga shares 24% of regional rice household stocks
- Among provinces, Kalinga had the biggest share of the regional rice household stocks with 24.3 percent (14,115 MT), followed by Benguet at 21.6 percent (12,512 MT) and Abra at 21.4 percent (12,387 MT).
- Mt. Province had the least stocks at 9.8 percent (5,669 MT).
Figure 1. Percentage Distribution of Rice Household Stocks
Inventory by Province, CAR: As of December 1, 2018
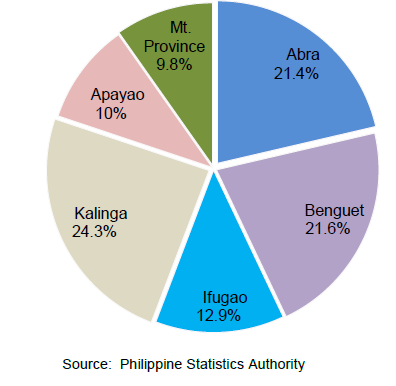
Figure 2. Rice Household Stocks Inventory by Month, CAR: 2017 & 2018
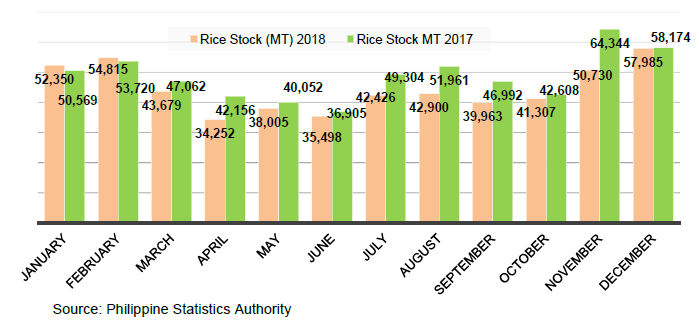
Monthly average rice stocks is about 44 thousand metric tons
- In 2018, the monthly average rice household stocks was estimated at 44,493 MT. The biggest stocks recorded was in the month of December at 57,985 MT, followed by February at 54,815 MT. The smallest stocks recorded in 2018 was in the month of April at 34,252 MT.
- Meanwhile in 2017, the highest household stocks recorded was in November at 64,344 MT, followed by December at 58,174 MT and February at 53,720 MT. The smallest stocks recorded was in June at 36, 905 MT.
- Monthly household stocks decreased in most months of 2018. The biggest decline was observed in November with 21.2 percent decrease, April with 18.7 percent, and August with 17.4 percent.
- On the other hand, household stocks the months of January and February increased by 3.5 percent and 2.0 percent, respectively.
Corn household stocks increases by 96%
- As of December 1, 2018, the national corn household stocks increased by 8.3 percent from the 88,749 MT stocks of same period last year.
- In CAR, the corn household stocks were estimated at 1,106 MT that comprised 1.2 percent only of the national household stocks. However, the regional household stocks increased by 96.1 percent from the 2017 stocks of 564 MT in 2017 to 1,106 MT in 2018.
Table 2. Corn Household Stocks Inventory by Province, CAR:
As of December 1, 2017 & 2018
| Region/Province | Corn Stock (MT) | % Change 2017 vs. 2018 |
% Share to Regional Stocks | |
|---|---|---|---|---|
| December 1, 2017 | December 1, 2018 | |||
| PHILIPPINES | 88,749 | 96,099 | 8.3 | |
| CAR | 564 | 1,106 | 96.1 | 100.0 |
| Abra | - | - | - | - |
| Benguet | 407 | 209 | (48.7) | 18.9 |
| Ifugao | - | 550 | - | 49.7 |
| Kalinga | 39 | 120 | 207.7 | 10.8 |
| Apayao | - | 166 | - | 15.0 |
| Mt. Province | 118 | 61 | (48.3) | 5.5 |
Source: Philippine Statistics Authority
- Corn household stocks in the province of Ifugao increased by 207.7 percent, while Ifugao had a sudden stock of 550 MT. On the other hand, Benguet and Mt. Province showed a decreasing trend.
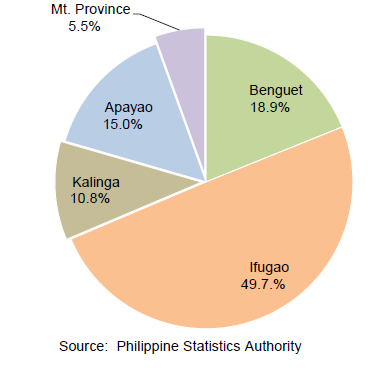
Ifugao shares 50 % of regional corn household stocks
- Among provinces, Ifugao had the biggest share to the regional stocks at 49.7 percent (550 MT), followed by Benguet at 18.8 percent (209 MT) and Apayao at 15.0 percent (192 MT).
Figure 3. Percentage Distribution of Corn Stocks Inventory
by Province, CAR: As of December 1, 2018
Monthly average corn stock is about 795 metric tons
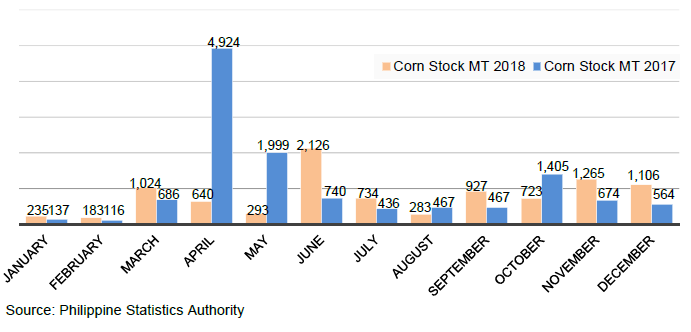
- In 2018, the monthly average household stocks reached 795 MT. The biggest stocks recorded was in June at 2,126 MT, followed by the month of November at 1,265 MT, and December at 1,106 MT. The smallest stocks recorded was in February at 183 MT.
- As shown in Figure 3, there were huge increases of stocks during the months of June, September and December 2018 at 187.3 percent, 98.5 percent and 96.1 percent, respectively. However, there were also big decreases during the months of April and May 2018 at 87.0 percent and 85.3 percent, respectively.
Figure 4. Corn Household Stock Inventory by Month, CAR: 2017 & 2018
TECHNICAL NOTES
Palay and Corn Stocks Survey (PCSS) is a monthly survey which produces estimates of the current stocks of rice and corn in farming and non-farming households.
Household Stocks are the supply stored in the household for future purposes, excluding stocks in commercial warehouses.
