

CAR rice household stocks estimated at 58 thousand metric tons
-
As of December 1, 2017, the Philippines rice household stocks inventory was recorded at 1,636,526 metric tons (MT), this decreased by 2.5 percent as compared to the 1,678,108 MT of same month last year.
-
In the Cordillera region, the household stocks inventory was estimated at 58,174 MT comprising 3.6 percent of the national household stocks. This was 14.9 percent higher than of 2016 at 50,646 MT.
Table 1. Rice Household Stocks Inventory by Province, CAR:
As of December 1, 2016 & 2017

-
All household stocks in the provinces showed an increasing trend except for Kalinga which decreased by 17.0 percent. Benguet had the biggest increase of 22.4 percent, followed by Abra at 23.2 percent.
Benguet shares ¼ of regional rice household stocks
-
Among provinces, Benguet had the biggest share of the regional rice household stocks with 24.7 percent (14,392 MT), followed by Abra at 20.6 percent (11,963 MT) and Apayao at 17.0 percent (10,207 MT).
Figure 1. Percentage Distribution of Rice Household Stocks
Inventory by Province, CAR: As of December 1, 2017
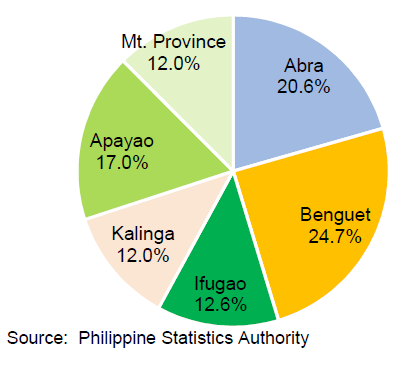
- Meanwhile, Kalinga had the least stocks at 12.0 percent (7,007 MT).
Figure 2. Rice Household Stocks Inventory by Month, CAR: 2016 & 2017
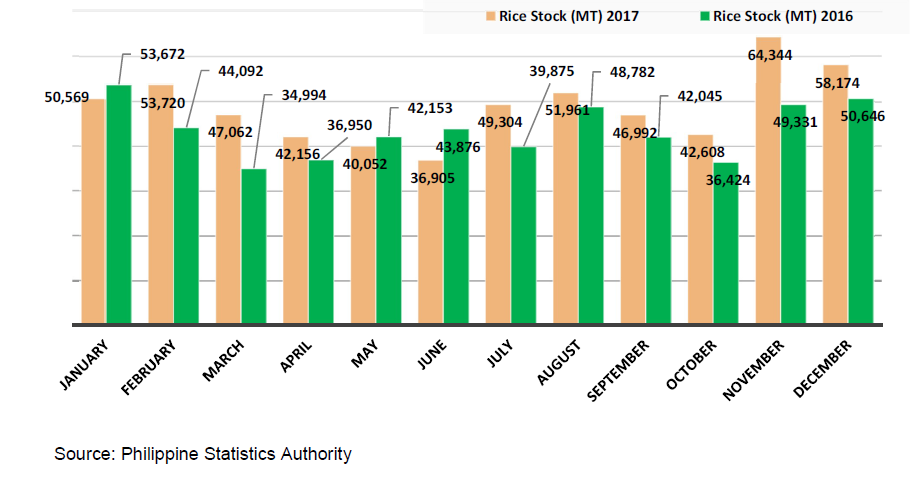
Monthly average rice stocks is about 49 metric tons
-
In 2017, the monthly average rice household stocks was estimated at 48,654 MT. The biggest stocks recorded was in the month of November at 64,344 MT, followed by December at 58,174 MT. The smallest stocks recorded in 2017 was in the month of June at 36,905 MT.
-
Meanwhile in 2016, the highest household stocks recorded was in January at 53,672 MT, followed by December at 50,646 MT and November at 49,331 MT. The smallest stocks recorded was in March at 34,994 MT.
-
Monthly household stocks increased in most months of 2017. The biggest increase was in November with 30.4 percent increase, March with 34.5 percent, and February with 21.8 percent.
-
On the other hand, the month of June recorded the biggest decline with negative 15.9 percent.
Corn household stocks increases by 246%
-
In 2017, the national corn household stocks decreased by 41.0 percent from the 150,518 MT output of December 2016.
-
In CAR, the corn household stocks were estimated at 564 MT that comprised 0.6 percent only of the national household stocks. However, the regional household stocks increased by 246.0 percent from the 2016 output of 163 MT.
Table 2. Corn Household Stocks Inventory by Province, CAR: As
of December 1, 2016 & 2017

-
Provincial corn household stocks increases ranged from 71.0 percent in Mt. Province to 333.0 percent in Benguet. The huge increases were a result of the recovery from the damages brought by typhoons Karen and Lawin during the last quarter of 2016.
Benguet shares 70 % of regional corn household stocks
-
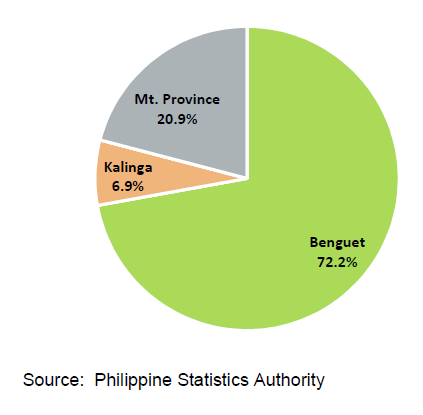
Among provinces, only three were recorded with corn household stocks. Benguet had the biggest at 72.2 percent (407 MT), followed by Mt. Province at 20.9 percent (118 MT) and Kalinga at 6.9 percent (39 MT).
Figure 4. Percentage Distribution of Corn Stocks
Inventory by Province, CAR: As of December 1, 2017
Monthly average corn stock is about 1 metric ton
-
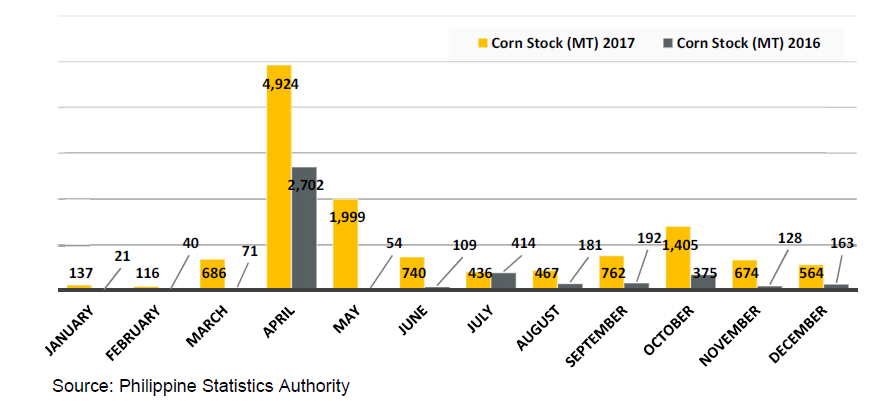
In 2017, the monthly average household stocks reached 1,076 MT. The biggest stocks recorded was in April at 4,924 MT, followed by the month of May at 1,999 MT, and October at 1,405 MT. The smallest stocks recorded was in January at 137 MT.
-
As shown in Figure 3, all monthly household stocks reported in 2017 had huge increases as compared to 2016. The biggest increase was in April at 82.2 percent (2,222 MT), followed by May at 3,601.8 percent (1,945 MT), and October at 274.7 percent (1,030 MT).
Figure 3. Rice Household Stock Inventory by Month, CAR: 2016 & 2017
Technical Notes
Aquaculture is a fishery operation involving all forms of raising and culturing of fish and other fishery species in fresh, brackish and marine water areas. The operation is comprised of activities from stocking to harvesting of species under controlled conditions in farming facility called aquafarm.
Aquafarm refers to the farming facilities used in the culture or propagation of aquatic species for purposes of rearing to enhanced production.
Freshwater is water without salt or marine origin.
Aquaculture Production refers to the volume harvested from the aquafarm during the reference period. It includes those species harvested in marketable or matured size and fresh in form.
Fishponds refers to a land-based type of aquafarm; a body of water (artificial or natural) where fish are cultured, raised or cultivated under controlled conditions.
Fish Cage refers to a stationary or floating fish enclosure made of synthetic net wire/bamboo screen set in the form of inverted mosquito net (“hapa” type) for aquaculture purposes.
Area Harvested is the actual area which harvests are realized.
Inland municipal fishing is the catching of fish, crustacean, mollusks and other aquatic animal and plants in inland waters like lakes, rivers, dams etc. using simple gears and fishing boats some of which are non-motorized with a capacity of less than three (3) gross tons, or fishing not requiring the use of fishing boats.
Inland municipal Production refers to the volume of catch during the reference period.
