

Release Date :
Reference Number :
2023-CAR11-596
1. Philippines
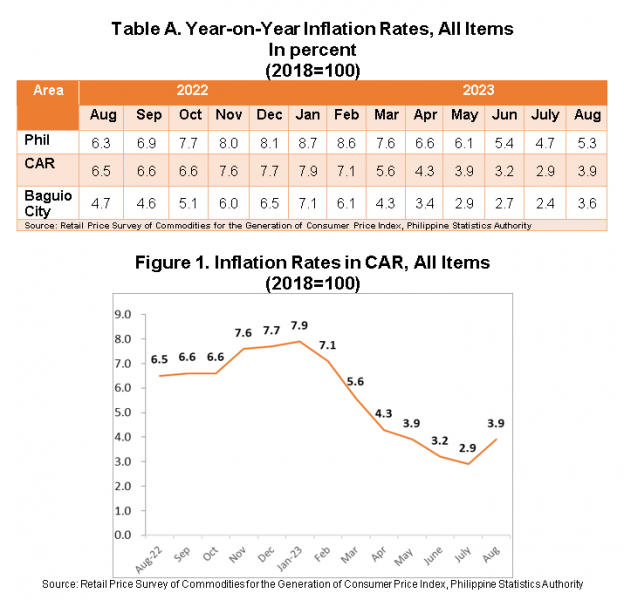
The Philippines’ headline inflation or overall inflation increased to 5.3 percent in August 2023 from 4.7 percent in July 2023. This brings the national average inflation from January to August 2023 to 6.6 percent. In August 2022, inflation rate was higher at 6.3 percent.
The uptrend in the overall inflation in August 2023 was primarily influenced by the higher year-on-year increase in the heavily-weighted food and non-alcoholic beverages at 8.1 percent during the month from 6.3 percent in the previous month. The annual growth of transport at 0.2 percent during the month, from an annual decline of -4.7 percent in July 2023, also contributed to the uptrend. In addition, the recreation, sport and culture index recorded an annual increase of 4.9 percent during the month from 4.7 percent in July 2023.
In contrast, six commodity groups showed lower inflation rates during the month:
- Alcoholic beverages and tobacco, 10.1 percent from 10.9 percent;
- Housing, water, electricity, gas and other fuels, 2.5 percent from 4.5 percent;
- Furnishings, household equipment and routine household maintenance, 5.6 percent from 5.8 percent;
- Education services, 2.9 percent from 3.7 percent;
- Restaurants and accommodation services, 7.1 percent from 7.9 percent; and
- Personal care, and miscellaneous goods and services, 5.5 percent from 5.6 percent.
The indices of the rest of the commodity groups retained their respective previous month’s annual increases, while the financial services remained at zero growth during the month.
The top three commodity groups contributing to the August 2023 overall inflation were the following:
- Food and non-alcoholic beverages with 57.4 percent share or 3.0 percentage points;
- Restaurants and accommodation services with 12.8 percent share or 0.7 percentage point; and
- Housing, water, electricity, gas and other fuels with 10.0 percent share or 0.5 percentage point.
2. Cordillera Administrative Region (CAR)
Inflation in the region increase to 3.9 percent in August 2023, from 2.9 percent in July 2023. In August 2022, inflation was observed at 6.5 percent.
Higher inflation rate in food and non-alcoholic beverages at 8.9 percent from 7.2 percent in July 2023 was the main driver in the uptrend of inflation in the region. This was followed by transport at -0.2 percent from -5.5 percent, and restaurants and accommodation services at 6.5 percent from 5.5 percent in the previous month. Also contributed to the uptrend is education services at 0.9 percent from the 0.6 percent inflation.
On the other hand, the following commodity groups had downtrend for the month:
- Alcoholic beverages and tobacco, 6.5 percent from 6.9 percent;
- Clothing and footwear, 3.3 percent from 3.7 percent;
- Housing, water, electricity, gas and other fuels, -0.9 from 0.1;
- Health, 2.4 percent from 2.9 percent;
- Recreation, sport and culture, 3.9 percent from 4.3 percent; and
- Personal care, and miscellaneous goods and services, 3.6 percent from 4.1 percent.
Information and communication, financial services, and furnishing, household equipment and routine household maintenance had the same inflation rate from the previous month at 0.1, 0.0, and 3.9 percent, respectively.
3. Baguio City
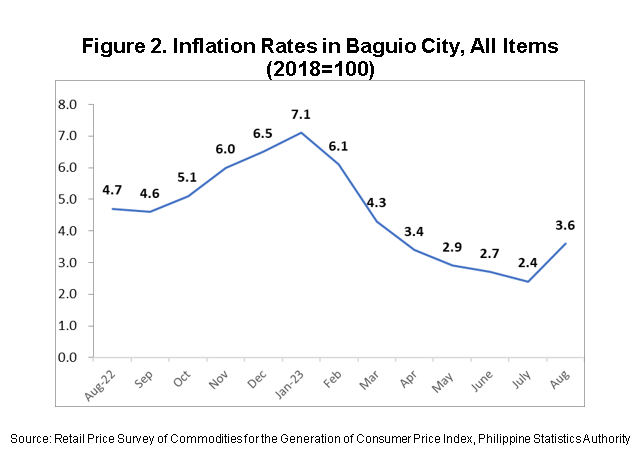
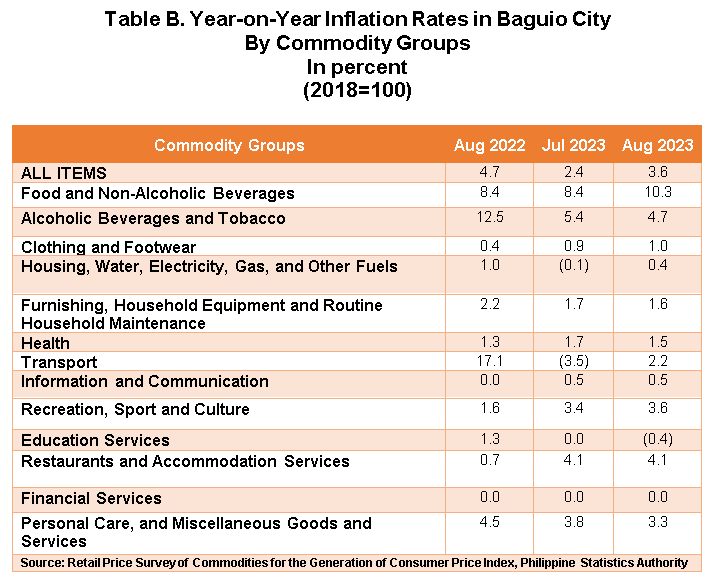
Following the trend of the inflation at the national and regional level, inflation in Baguio City increased to 3.6 percent in August 2023, from 2.4 percent in July 2023. In August 2022, inflation was higher at 4.7 percent. (Table B and Figure 2)
The main driver in the uptrend of inflation in August 2023 was transport at 2.2 percent, from -3.5 percent in July 2023. This was followed by food and non-alcoholic beverages at 10.3 percent, from 8.4 percent, and housing, water, electricity, gas, and other fuels at 0.4 percent, from the -0.1 percent in the previous month.
Relative to their annual rates in the previous month, increases were also observed in the indices of the following commodity groups:
- Clothing and footwear, 1.0 percent from 0.9 percent; and
- Recreation, sport and culture, 3.6 percent from 3.4 percent.
On the contrary, decreases were observed in the index of the following:
- Alcoholic beverages and tobacco, 4.7 percent from 5.4 percent;
- Furnishing, household equipment and routine household maintenance, 1.6 percent from 1.7 percent;
- Health, 1.5 percent from 1.7 percent;
- Education services, -0.4 percent from 0.0 percent; and
- Personal care, and miscellaneous goods and services, 3.3 percent from 3.8 percent.
Meanwhile, the following commodity groups remained at their previous month’s annual rates (Table 3):
- Information and communication, 0.5 percent;
- Restaurants and accommodation services, 4.1 percent; and
- Financial services, 0.0 percent.
Food inflation at the city level increased to 10.7 percent in August 2023, from 8.7 percent in July 2023. In August 2022, food inflation stood at 8.7 percent. (Table 5,9)
The higher food inflation was mainly brought about by vegetables, tubers, plantains, cooking bananas and pulses at 43.7 percent this month from the 32.4 percent in July 2023. It was followed by fish and other seafood at 8.9 percent from 4.5 percent, and meat and other parts of slaughtered land animals at 0.2 percent from -0.5 percent of the previous month.
Increases were also observed for the following:
- Rice, 4.6 percent from 4.2 percent;
- Corn, 66.8 percent from 56.7 percent; and
- Flour, bread and other bakery products, pasta products, and other cereals, 11.2 percent from 11.1 percent.
On the other hand, the following food groups had lower rates this month:
- Milk, other dairy products and eggs, 12.0 percent from 12.1 percent;
- Oils and fats, 3.3 percent from 4.4 percent;
- Fruits and nuts, 5.5 percent from 6.6 percent;
- Sugar, confectionery and desserts, 9.9 percent from 17.4 percent; and
- Ready-made food and other food products n.e.c, 4.9 percent from 5.9 percent.
Note: CPIs and inflation rates by region, province and selected city are posted at the PSA website (https://openstat.psa.gov.ph/).
IMELDA L. BUYUCCAN
Chief Statistical Specialist
/SMBP
| Attachment | Size |
|---|---|
|
|
310.53 KB |