

Release Date :
Reference Number :
25CAR32-188
The Headline Inflation rate for the bottom 30 percent Income Households in Kalinga goes up to 4.9 percent in January 2025, from 3.8 percent in December 2024. In January 2024, inflation rate was observed at -1.0 percent.
Table 1: Year-on-Year Inflation Rates, Bottom 30% Income Households: Kalinga
(2018=100)
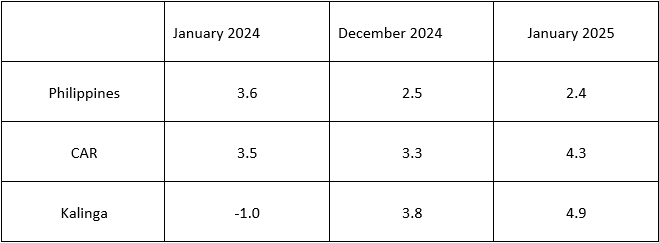
Figure 1: Headline Inflation Rates for the Bottom 30% Income Households in Kalinga, All Items in percent
(2018=100)
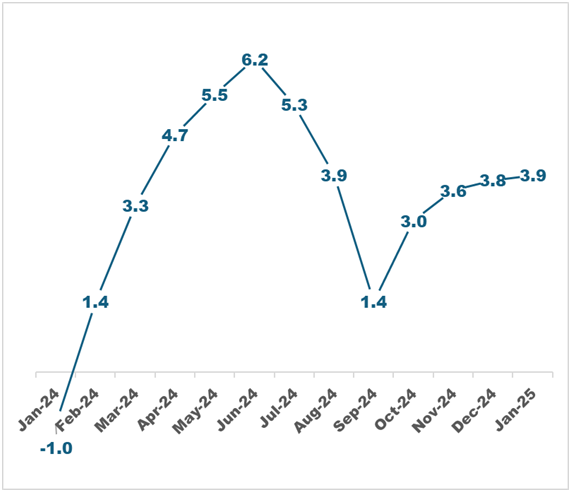
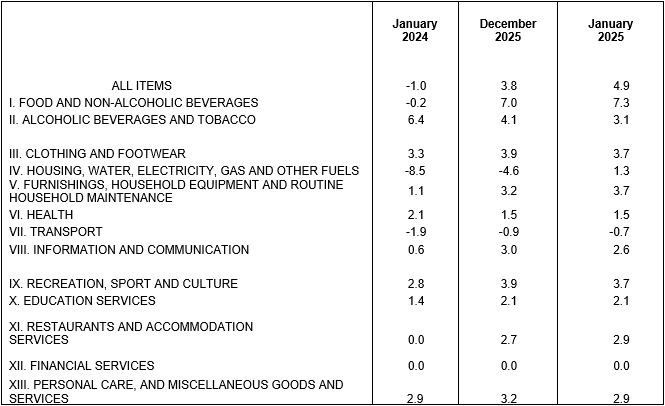
Table 2: Year-on-Year Inflation in Kalinga, By Commodity Groups in percent
January 2025
(2018=100)
Main Drivers to the Upward Trend of the Headline Inflation
The uptrend in the overall inflation in January 2025 was primarily brought about by the annual increment of housing, water, electricity, gas and other fuels at 1.3 percent from -4.6 percent in the previous month. Also contributing to the uptrend were foods and non-alcoholic beverages with 7.3 percent from 7.0 percent, and restaurants and accommodation services with 2.9 percent from 2.7 percent.
Higher annual increments were also noted in the index of the following commodity groups during the month:
a. Transport, -0.7 percent from -0.9 percent; and
c. Furnishings, household equipment and routine household maintenance, 3.7 percent from 3.2 percent.
On the other hand, the indices of the following items exhibited a lower decrease during the month;
a. Information and communication, 2.6 percent from 3.0 percent;
b. Personal care, goods and miscellaneous services, 2.9 percent from 3.2 percent;
c. Recreation, sports and culture, 3.7 percent from 3.9 percent;
d. Alcoholic beverages and tobacco, 3.1 percent from 4.1 percent; and
e. Clothing and footwear, 3.7 percent from 3.9 percent.
Meanwhile, there is no change in the commodity group of Financial Services and Health.
Main Contributors to the Headline Inflation
The top three (3) commodity groups contributing to the January 2025 overall inflation was the following:
a. Food and non- alcoholic beverages;
b. Restaurants and accommodation services, and
c. Furnishings, household equipment and routine household maintenance
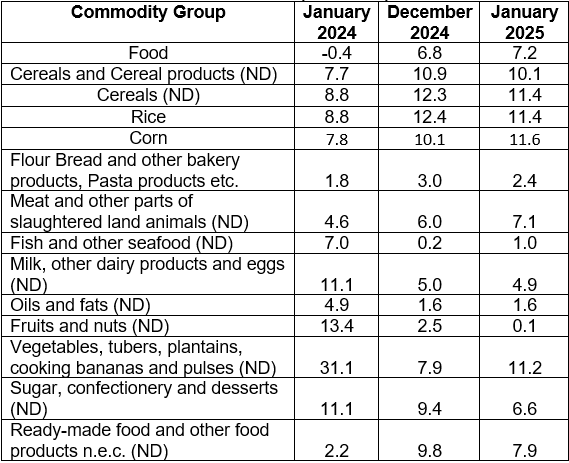
Table 3: Year-on-Year Food Inflation in Kalinga, in percent
January 2025
(2018=100)
Food inflation
Food inflation at the provincial level for the bottom 30% income household increased to 7.2 percent in January 2025 from 6.8 percent in the previous month. In January 2024, food inflation was lower at -0.4 percent.
Main Drivers to the Upward Trend of Food Inflation
The acceleration of food inflation in January 2025 was primarily brought about by vegetables, tubers, plantains, cooking bananas and pulses with 11.2 percent from 7.9 percent in the previous month. This was followed by meat and other parts of slaughtered land animals with 7.1 percent from 6.0 percent and fish and other sea foods with 1.0 percent from 0.2 percent.
On the other hand, the following commodity groups registered lower inflation rates during the month:
a. Sugar, confectionery and desserts with 6.6 percent from 9.4 percent;
b. Fruits and nuts with 0.1 percent from 2.5 percent;
c. Cereals and cereal products with 10.1 percent from 10.9 percent;
d. Flour and other bakery products with 2.4 percent from 3.0 percent;
e. Ready-made food and other food products n.e.c. with 7.9 percent from 9.8 percent and
f. Milk, other dairy products and eggs with 4.9 percent from 5.0 percent.
Main Contributors to the Food Inflation
The top three (3) food groups in terms of contribution to the food inflation during the month were the following;
a. Cereals and cereal products;
b. Vegetables, tubers, plantains, cooking bananas and pulses; and
c. Meat and other parts of slaughtered land animals.
Note: CPI’s and inflation rates by region, province and selected city are posted at the PSA website (www.psa.gov.ph).
sgd.
MARIBEL M. DALAYDAY
Chief Statistical Specialist