Ifugao CPI at 117.5 in September 2019
Survey of Retail Prices of Commodities conducted by Philippine Statistics Authority (PSA) has generated a Consumer Price Index (CPI) of 117.5 for Ifugao as of September 2019, using 2012 as the base year. This indicates that the average cost of a basket of goods and services commonly purchased by a typical Filipino household in the different municipalities of Ifugao decreased during the reference month. This is -0.20 index points lower than August 2019 with CPI = 117.7 and 3.9 index points higher a year ago.
Table 1. Monthly Consumer Price Index for All Income Households by Commodity Group,
Ifugao, CAR: September 2019 and August 2019 (2012 = 100)
| Commodity Group |
Sept 2019 |
Sept 2018 |
Aug 2019 |
Aug 2018 |
|---|
| All Items |
117.5 |
113.6 |
117.7 |
113.1 |
|
Food and Non - Alcoholic
Beverages
|
114.3 |
113.1 |
114.7 |
112.8 |
|
Alcoholic Beverages and
Tobaco
|
216.4 |
182.7 |
216.4 |
179.9 |
| Clothing and Footwear |
128.0 |
120.1 |
128.0 |
120.0 |
|
Housing, Water, Electricity,
Gas and Other Fuels
|
124.2 |
121.6 |
124.3 |
119.8 |
Furnishing, Household
Equipment and Routine
Maintainance of the House |
113.0 |
121.4 |
113.0 |
111.8 |
| Health |
128.3 |
106.0 |
127.5 |
106.0 |
| Transport |
105.0 |
100.8 |
105.1 |
100.0 |
| Communication |
101.0 |
101.0 |
101.0 |
101.4 |
| Recreation and Culture |
108.0 |
106.1 |
107.7 |
106.0 |
| Education |
107.1 |
100.0 |
107.1 |
100.0 |
Restaurants and
Miscellaneous Goods
and Services |
115.8 |
111.3 |
115.8 |
110.7 |
Source: Philippine Statistics Authority
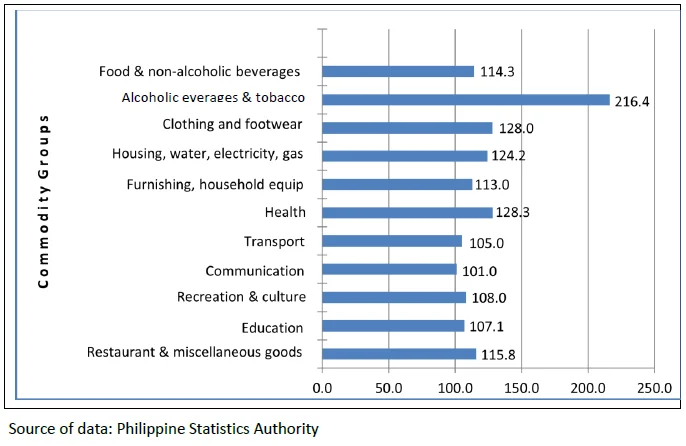
Commodities under the groups of the Alcoholic beverages and tobacco, Health, Clothing & footwear and Housing, water, electricity, gas and other fuel had the highest corresponding CPI’s of 216.4, 128.3, 128.0 and 124.2 in September 2019, respectively. These four commodity groups have CPI’s higher than the total average CPI of all items in the province.
On the other hand, Education and Communication with CPI’s 107.1 and 101.0, respectively, have no significant changes across the months. These mean that price of education increased by 7.1 percent since 2012 and cost of communication in the province slightly moved from the base year.
Figure 1. Consumer Price Index of All Income Households in
Ifugao, CAR: September 2019 (2012=100)
Inflation Rate
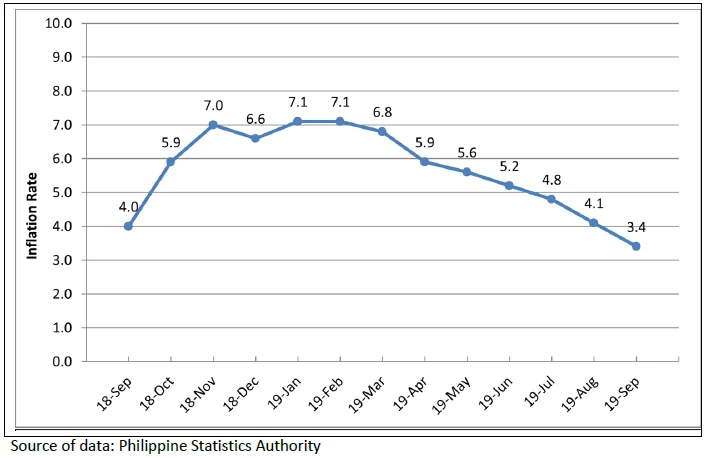
The average headline Inflation Rate in Ifugao deccelarated at 3.4 percent as of September 2019 as compared to the same period in the previous year. As shown in Figure 2, the trend has been increasing and the results for September 2019 posted significant decreased from the previous month.
As shown in table 2, Health with (21.0 percent) and Recreation and culture (1.8 percent) were the commodity groups that posted the higher growth rates in September 2019, respectively. On the other hand, Alcoholic beverages and tobacco had the most rapidly changing average price between the month of September 2019 and August 2019 with a decrease of –1.9 percentage points.
Figure 2. Year-on-Year Headline Inflation Rate, All Items by Commodity Group, Ifugao,
CAR: September 2018 - September 2019 (2012 = 100)
Table 2. Month-on- Month Headline Inflation Rate, All items by Commodity Group,
Ifugao, CAR: September 2019 and August 2019 (2012=100)
| Commodity Group |
Sept 2019 |
Aug 2019 |
Difference |
|---|
| All Items |
3.4 |
4.1 |
(0.7) |
|
Food and Non - Alcoholic
Beverages
|
1.1 |
1.7 |
(0.6) |
|
Alcoholic Beverages and
Tobaco
|
18.4 |
20.3 |
(1.9) |
| Clothing and Footwear |
6.6 |
6.7 |
(0.1) |
|
Housing, Water, Electricity,
Gas and Other Fuels
|
2.1 |
3.8 |
(1.7) |
Furnishing, Household
Equipment and Routine
Maintainance of the House |
0.5 |
1.1 |
(0.6) |
| Health |
21.0 |
20.3 |
0.7 |
| Transport |
4.2 |
5.1 |
(0.9) |
| Communication |
0.0 |
(0.4) |
0.4 |
| Recreation and Culture |
1.8 |
1.6 |
0.2 |
| Education |
7.1 |
7.1 |
0.0 |
Restaurants and
Miscellaneous Goods
and Services |
4.0 |
4.6 |
(0.6) |
Source: Philippine Statistics Authority
Purchasing Power of Peso
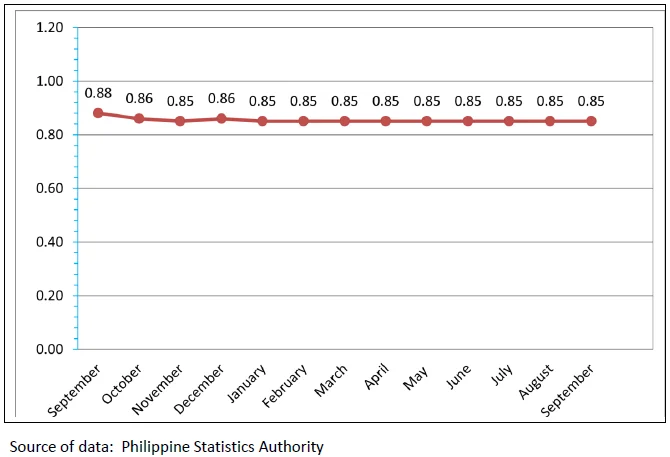
Purchasing Power of Peso (PPP) is inversely related to inflation rate. Thus, as the inflation rate increases, PPP declines. In Ifugao, PPP decreased by 4.6 percent in 2018 and has been decreasing at an average rate of 0.60 percent monthly in the year 2018.
The average PPP in Ifugao in 2018 is at 0.88. This implies that the Php 1.00 in 2012, as the base year, values only Php 0.88 in 2018. As a result of the prices changes reflected in the CPI, the provincial Purchasing Power of the Peso remained at 0.85 as shown in figure 3.
Figure 3. Monthly Purchasing Power of Peso in Ifugao:
September 2018 – September 2019 (2012=100)


