

Release Date :
Reference Number :
SR 2020-37
The Family Income and Expenditure Survey (FIES) is a nationwide survey of households undertaken every three years. It is a main source of data on family income and expenditure, which include among others, levels of consumption by item of expenditure as well as sources of income in cash and in kind. The results of FIES provide information on the levels of living and disparities in income of Filipino families, as well as their spending patterns.
Average family income in CAR is 29.5 thousand pesos monthly
- In 2018, families in the Cordillera Administrative Region (CAR) had an average annual family income of 354 thousand pesos. In comparison, the annual expenditure for the same year was 230 thousand pesos on average. These figures meant an average annual saving of 124 thousand pesos per family.
Figure 1. Number of Families, Total and Average Annual Family Income
and Expenditure, CAR: 2015 and 2018

- The average family income of the region increased by 25.5 percent from 2015 to 2018. Also, the region’s average annual expenditure also increased by 10 percent from 2015 to 2018. And the average savings increased by almost 70 percent.
- In real terms (taking out the effect of inflation) and using 2012 prices, the average annual family income in CAR in 2018 would be valued at 305 thousand pesos while the average annual family expenditure would be valued at 199 thousand pesos.
Richest have income 9 times that of the poorest and spend 4 times than the poorest
- Families were grouped and ranked into per capita income deciles. The richest decile represents families belonging to the highest ten percent in terms of per capita income, while the poorest decile represents families in the lowest ten percent. From 2012 to 2018, the average annual family income in all deciles increased.
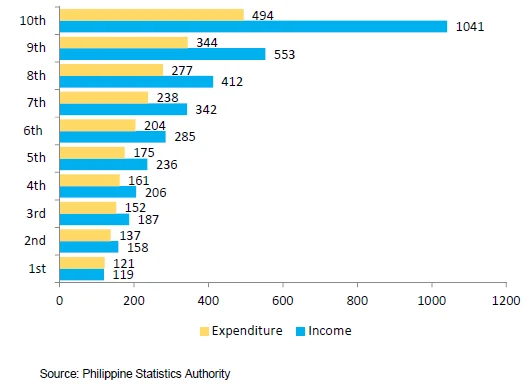
- In 2018, the mean family income in the region ranged from 121 thousand pesos for the 1st income decile (poorest) to 494 thousand pesos for the 10th income decile (richest). For the expenditure, it ranged from 119 thousand pesos for the 1st income decile to 1,041 for the 10th income decile.
- The average annual family income of the tenth decile in 2018 was almost nine times that of the first decile while the expenditure is four times higher from the first to the tenth decile.
Figure 2: Mean Family Income and Expenditure by Per Capita Income
Decile, CAR: 2018 (In Thousand Pesos)
Spending on house rental and utilities remain second to food expenses
- More than a third of the total expenses of all income groups in 2018 were on food, followed by spending on house rental which was at 15.6 percent.
- The percent share of expenditure on Water, Electricity, Gas and Other Fuels came third with 8.6 percent.
Figure 3: Expenditure Pattern of All Income Groups, CAR: 2018
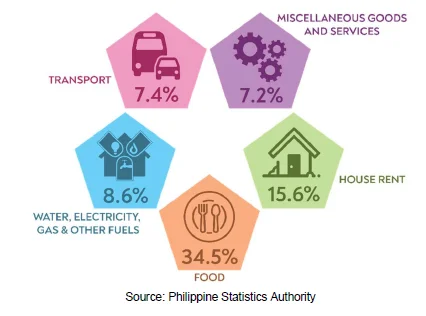
- Poor families spent more on education (0.7% of the total expenditure) than on alcoholic beverages and tobacco (0.4% of the total expenditure).
Income disparity remains wide but improved in 2018
- The Gini coefficient, a measure of income inequality within a population, was estimated at 0.4267 in 2018 for the whole Philippines. This figure was lower than the 2015 ratio of 0.4438, which may indicate some improvement in the income distribution among families (Table 1). A Gini coefficient ranges from 0 to 1, with 0 indicating perfect income equality among families, while value of 1 indicates absolute income inequality.
- Five regions had higher coefficients than the national including the Cordillera Administrative Region (0.4437). The other four regions were Eastern Visayas (0.4457), Central Visayas (0.4425), Caraga (0.4383) and SOCCSAKSARGEN (0.4303). ARMM had the lowest Gini coefficient at 0.2819.
- The Gini coefficient of income of families in CAR was estimated at 0.4437 in 2018, higher than the estimated coefficient in 2015 at 0.4209. This could mean that income inequality in CAR widened.
Table 1: Gini Concentration Ratios by Region: 2015 and 2018
| Region | 2015 | 2018 |
|---|---|---|
| Philippines | 0.4438 | 0.4267 |
| National Capital Region | 0.3908 | 0.3520 |
| Cordillera Administrative Region | 0.4209 | 0.4437 |
| I - Ilocos Region | 0.3977 | 0.3893 |
| II - Cagayan Valley | 0.4063 | 0.4278 |
| III - Central Luzon | 0.3939 | 0.3717 |
| IVA - CALABARZON | 0.4011 | 0.3952 |
| IVB - MIMAROPA | 0.4564 | 0.4230 |
| V - Bicol Region | 0.3960 | 0.3937 |
| VI - Western Visayas | 0.4361 | 0.4241 |
| VII - Central Visayas | 0.4645 | 0.4425 |
| VIII - Eastern Visayas | 0.4647 | 0.4457 |
| IX - Zamboanga Peninsula | 0.4359 | 0.4231 |
| X - Northern Mindanao | 0.4633 | 0.4059 |
| XI - Davao Region | 0.4294 | 0.4108 |
| XII - SOCCSKSARGEN | 0.4624 | 0.4303 |
| CARAGA | 0.4336 | 0.4383 |
| Autonomous Region in Muslim Mindanao | 0.2800 | 0.2189 |
| Attachment | Size |
|---|---|
|
|
873.95 KB |