

Release Date :
Reference Number :
24CAR32-319
Corn Production
Corn total production in Cordillera Administrative Region (CAR) was estimated at 171,771.54 metric tons in January to December 2023. Kalinga has the highest contribution with 63,660.19 metric tons or 37 percent share. Ifugao ranked 2nd with 51,784.01 metric tons or 30 percent, Mountain Province ranked 3rd with 23,281.09 or 14 percent, then Apayao with 17,005.45 metric tons or 10 percent, Abra with 15,575 metric tons or 9 percent and the least was Benguet with 465.80 metric tons or 0.27 percent share. See figure 1.
Figure 1. Corn Production Distribution by Province in Cordillera Administrative Region:
January to December 2023
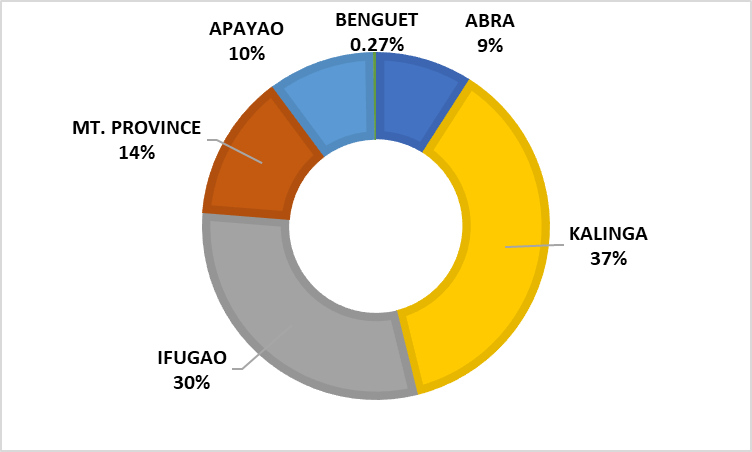
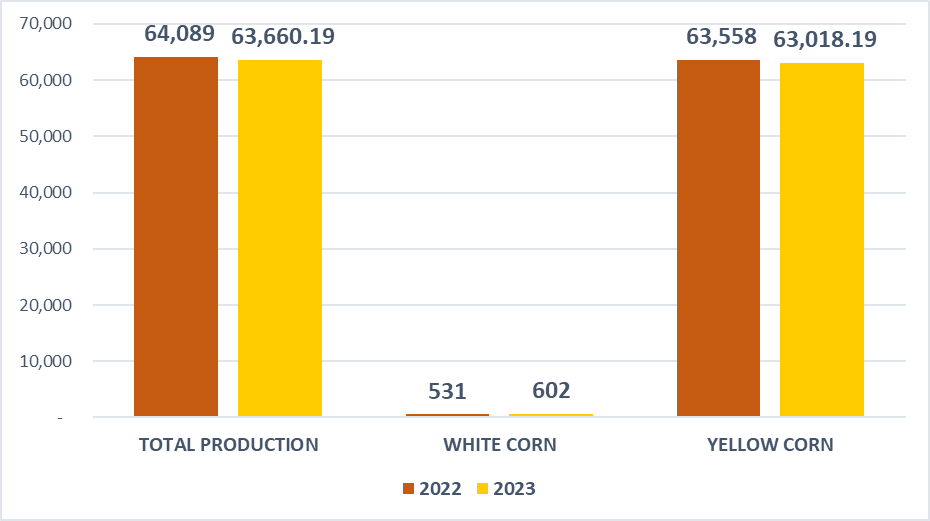
Figure 2 showed that total corn production decreased in January to December 2023 as compared to January to December 2022. White corn reported production in Kalinga was estimated at 602 metric tons in January to December 2023. It increased by 71 metric tons as compared to January to December 2022 with 531 metric tons. Yellow corn production decreased from 63,558 metric tons in 2022 to 63,058.19 metric tons in 2023.
Figure 2. Corn Production (Mt.) by Type: Kalinga
January to December 2022-2023
Corn Harvested Area
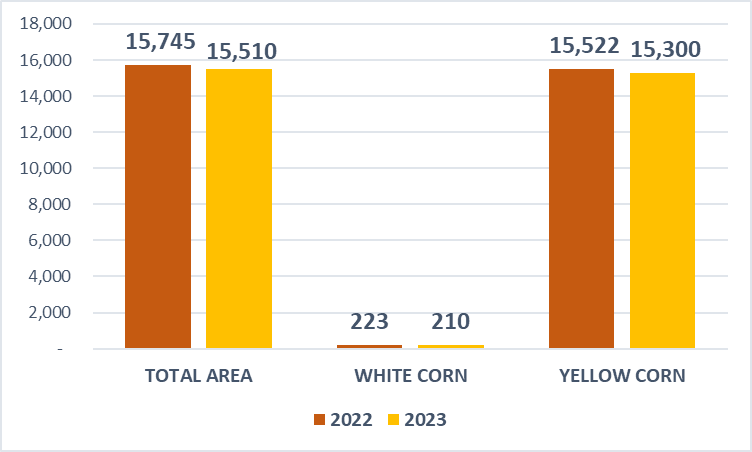
Total corn harvested area in January to December 2023 in Kalinga was estimated at 15,510 hectares. It decreased by 1.49 percent as compared to January to December 2022 with 15,745 hectares. White corn reported area harvested was decreased by 13 hectares from 223 hectares in January to December 2022 to 210 hectares in January to December 2023. The same with yellow corn harvested area reported in 2023 it decreased by 222 hectares as compared to 2022.
Figure 3. Corn Harvested Area (Ha.) by Type: Kalinga
January to December 2022-2023
Corn Yield/Hectare
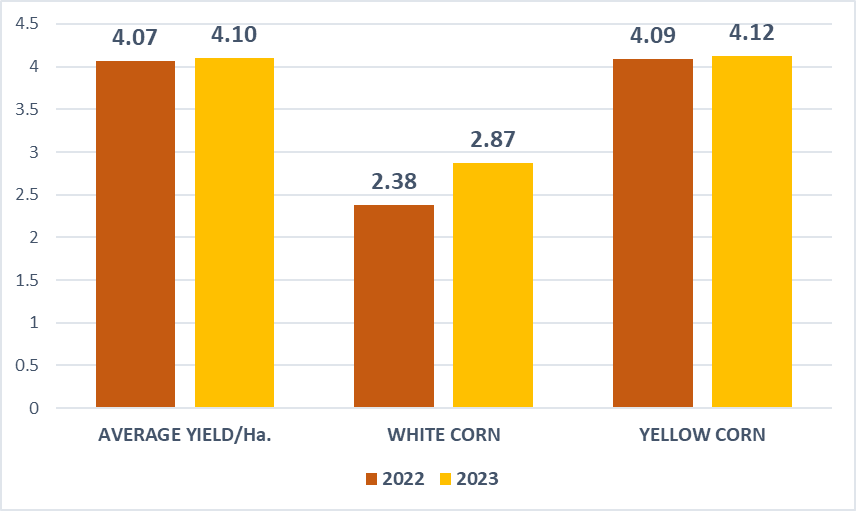
Estimated at 4.10 metric tons per hectare was reported as corn yield in January to December 2023. It increased by 0.74 percent over the yield per hectare in January to December 2022 with 4.07 metric tons. This was due to the increased in yield per hectare of white corn from 2.38 metric tons in January to December 2022 to 2.87 metric tons in January to December 2023 and yield per hectare of yellow corn increased by 0.03 metric tons or 0.73 percent.
Figure 4. Corn Yield per Hectare (Mt.) by Type: Kalinga
January to December 2022-2023
TECHNICAL NOTES
The Corn Production Survey (CPS) is one of the major agricultural surveys conducted by the Philippine Statistics Authority (PSA). This generates estimates on corn production, area, yield and other production-related data that serves as inputs for policy making and programs on palay/rice and corn.
Production data generated by the CPS are inputs to the Performance of Agriculture Report (PAR) and accordingly to the preparation of the Gross Domestic Product (GDP). Moreover, the survey supports the data needs of planners, policy and decision-makers, and other stakeholders in the agriculture sector particularly the National Economic and Development Authority (NEDA), Department of Agriculture (DA) and its attached agencies such as Philippine Rice Research Institute (PhilRice), Philippine Council for Agriculture and Fisheries (PCAF), and the general public.
Farm- A parcel or parcels of land which has a total area of at least 1,000 square meters (one-tenth of a hectare) used for agricultural purposes.
Area Harvested- This refers to the total area harvested during the reference period.
Production- refers to the quantity produced and actually harvested for particular crop during the reference period.
Yield- An indicator of productivity derived by dividing the total production by the area harvested.
White Corn- Type of corn used primarily for human consumption regardless of color.
Yellow Corn- Used generally as feed grains. It includes all types of corn other than white.
(SGD)
MARIBEL M. DALAYDAY
Chief Statistical Specialist
| Attachment | Size |
|---|---|
|
|
236.22 KB |