

Release Date :
Reference Number :
25CAR32-467
Table 1: Year-on-Year Inflation Rates, Bottom 30% Income Households: Kalinga
(2018=100)
Area | March 2024 | February 2025 | March 2025 | Year-to-Date |
Kalinga | 3.3 | 1.5 | 1.0 | 2.5 |
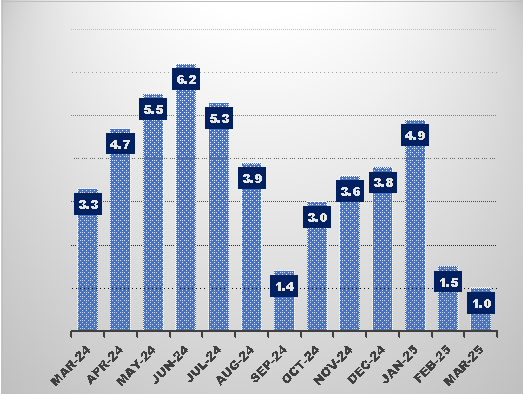
Figure 1: Inflation Rates of the Consumer Price Index for the Bottom 30% Income Households in Kalinga, All Items in percent
(2018=100)
- Overall Inflation
The Kalinga’s inflation rate for the bottom 30% income household decreased to 1.0 percent in March 2025 from 1.5 percent in February 2025. This makes the provincial average inflation at 2.5 percent. In March 2024, the inflation rate was higher at 3.3 percent.
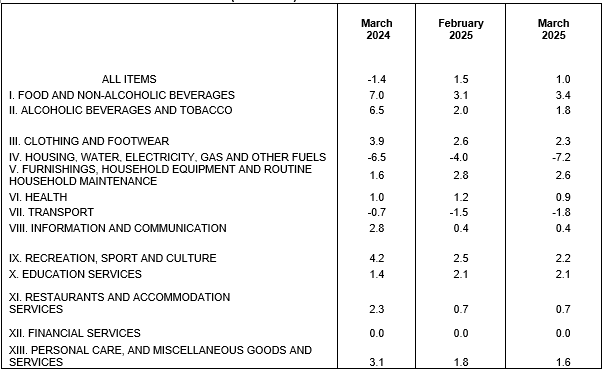
Table 2: Year-on-Year Inflation for the Bottom 30% Income Household in Kalinga, By Commodity Groups in percent
March 2025
(2018=100)
1.1 Main Drivers to the Upward Trend of the Headline Inflation
The decrease in the overall inflation for the Bottom 30% Income Households in March 2025 was primarily brought about by the monthly decrease of the following items,
a. Housing, water, electricity, gas and other fuels at -7.2 percent from -4.0 percent
b. Transportation at -1.8 percent from -1.5 percent;
c. Clothing and footwear at 2.3 percent from 2.6 percent;
d. Personal care, goods and miscellaneous services at 1.6 percent from 1.8 percent;
e. Health at 0.9 percent from 1.2 percent;
f. Alcoholic beverages and tobacco at 1.8 percent from 2.0 percent and
d. Furnishings, household equipment and routine household maintenance at 2.6 percent from 2.8 percent.
On the other hand, there is an increase from the group of Foods and non-alcoholic beverages with 3.4 percent from 3.1 percent.
Meanwhile, there is no change in the commodity group of Financial Services, Restaurants and accommodation services, Education services and Health.
- Food Inflation
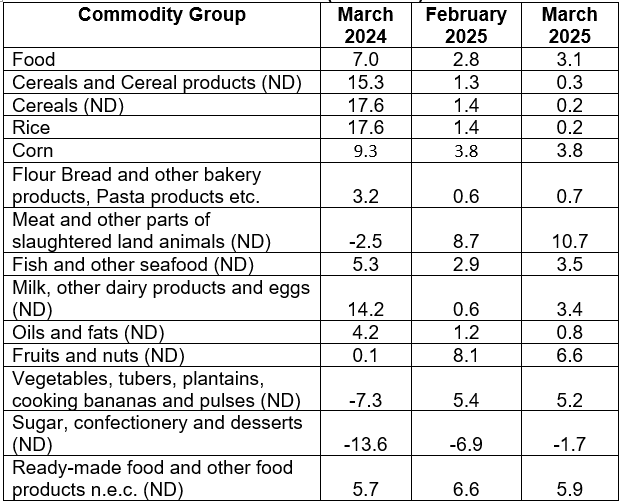
Food inflation at the provincial level for the bottom 30% income household increased to 3.1 percent in March 2025 from 2.8 percent in the previous month. In March 2024, food inflation was higher at 7.0 percent.
2.1 Main Drivers to the Upward Trend of Food Inflation
The acceleration of food inflation in March 2025 was primarily brought about by the following groups,
Meat and other parts of slaughtered land animals with 8.7 percent from 10.7 percent;
- Milk, other dairy products and eggs with 3.4 percent from 0.6 percent.
Sugar, confectionery and desserts with -1.7 percent from -6.9 percent and
Fish and other sea foods with 3.5 percent from 2.9 percent.
On the other hand, the following commodity groups registered lower inflation rates during the month:
Fruits and nuts with 6.6 percent from 8.1 percent;
- Oil and fats with 0.8 percent from 1.2 percent;
c. Cereals (ND) with 0.2 percent from 1.4 percent;
d. Ready-made food and other food products n.e.c. with 5.9 percent from 6.6 percent,
e. Flour and other bakery products with 0.6 percent from 0.7 percent;
and
f. Vegetables, tubers, plantains, cooking bananas and pulses with 5.2. percent from 5.4 percent.
Main Contributors to the Headline Inflation
The top three (3) commodity groups contributing to the March 2025 overall inflation was the following:
Meat and other parts of slaughtered land animals;
Milk, other dairy products and eggs and
Sugar, confectionery and desserts
Table 3: Year-on-Year Food Inflation for the Bottom 30% Income Household in Kalinga, in percent
March 2025(2018=100)
Main Contributors to the Food Inflation
The top three (3) food groups in terms of contribution to the food inflation during the month were the following;
- Meat and other parts of slaughtered land animals.
- Fish and other seafood (ND)
- Vegetables, tubers, plantains, cooking bananas and pulses
sgd.
MARIBEL M. DALAYDAY
Chief Statistical Specialist