

Release Date :
Reference Number :
22CAR32 - 99
Birth Statistics
The number of registered births in Kalinga in 2021 summed up to 5,330 showing an increase of 398 or 8.07 percent birth occurrences from the 2020 figure of 4,932. During the year, there was a daily birth occurrence of 15 or about five (5) babies born every 8 hours.
| Month of Registration | Number | Daily Average | ||
|---|---|---|---|---|
| 2020 | 2021 | 2020 | 2021 | |
| Kalinga | 4,932 | 5,330 | 14 | 15 |
| January | 604 | 321 | 20 | 11 |
| February | 474 | 244 | 16 | 8 |
| March | 390 | 440 | 13 | 15 |
| April | 217 | 387 | 7 | 13 |
| May | 287 | 428 | 10 | 14 |
| June | 347 | 455 | 12 | 15 |
| July | 437 | 442 | 15 | 15 |
| August | 377 | 555 | 13 | 19 |
| September | 474 | 554 | 16 | 18 |
| October | 409 | 472 | 14 | 16 |
| November | 499 | 537 | 17 | 18 |
| December | 417 | 495 | 14 | 17 |
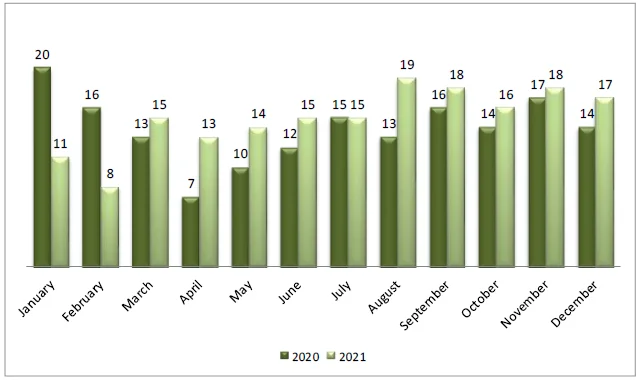
The highest daily average of 19 registered live birth was recorded in the month of August. On the contrary, February has the lowest daily average of 8 registered live births.
Moreover, August was the month with the highest number of registered live births. Births during the month counted to 555 or 10.41 percent of the total registered births in Kalinga in 2021. On the other end, the lowest number of registered live births was recorded in February with 244 or 4.58 percent.
In 2021, it can be observed that the months of August, September, October, November and December posted higher daily average number of registered births than the provincial average.
Figure1. Daily Average of Registered Live Births by Month:
Kalinga, 2020- 2021
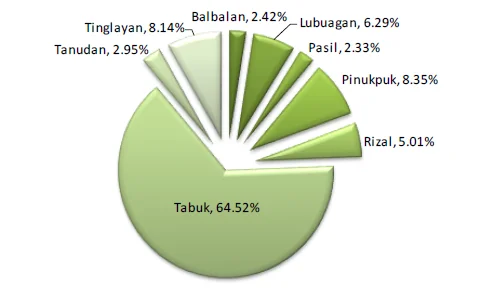
Among the city/municipalities in the province, the highest number of registered births was recorded in the City of Tabuk in 2021. It comprised 3,439 or 64.52 percent of the total births in Kalinga. Pinukpuk ranked second with 445 (8.35 percent) followed by Tinglayan with 434 (8.14 percent) and Lubuagan with 335 (6.29 percent).
On the other end, Balbalan had the lowest number of registered births with 129 (2.42 percent) in 2021.
Figure2. Percent Distribution of Registered Live Births
by City/Municipality: Kalinga, 2021
The Crude Birth Rate (CBR) in Kalinga in 2021 was computed at 23.22. This means that there were 23 live births per 1,000 persons in the province. The highest crude birth rate was computed in Lubuagan with 35.93 or 36 live births for every 1,000 persons in the municipality while the lowest was in Balbalan with 10 live births for every 1,000 persons.
Table2. Number of Registered Live Births and Crude Birth Rate by
City/Municipality, Kalinga: 2021
| City/Municipality | Number of Live Births | 2020 Population | Crude Birth Rate |
|---|---|---|---|
| Kalinga | 5,330 | 229,570 | 23.22 |
| Balbalan | 129 | 12,914 | 9.99 |
| Lubuagan | 335 | 9,323 | 35.93 |
| Pasil | 124 | 10,577 | 11.72 |
| Pinukpuk | 445 | 34,275 | 12.98 |
| Rizal | 267 | 19,554 | 13.65 |
| Tabuk City | 3,439 | 121,033 | 28.41 |
| Tanudan | 157 | 8,764 | 17.95 |
| Tinglayan | 434 | 13,148 | 33.01 |
Marriage Statistics
There were 863 marriages registered in 2021 showing an increase of 336 from the previous year’s registered figure of 527.
All of the 8 city/municipalities have increasing number of registered marriages in 2021. The biggest increase was noted in the City of Tabuk from 261 to 374 marriages or 43.29 percent.
Figure3. Number of Registered Marriages by City/Municipality,
Kalinga: 2020-2021
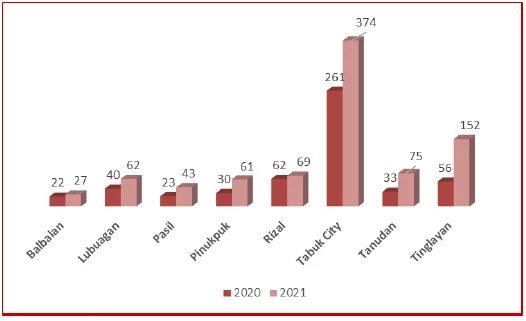
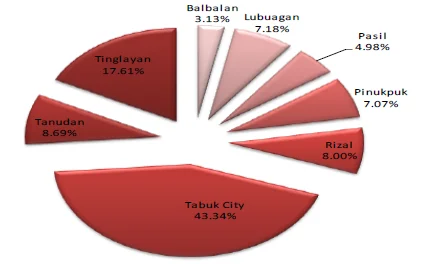
Tabuk City remained as the city/municipality with the most number of registered marriages in the province.
On the other end, the municipality of Balbalan posted the least number of registered marriages in 2021 with 27 (3.13 percent).
Figure4. Percent Distribution of Registered Marriages by
City/Municipality, Kalinga: 2021
The month of December recorded the highest number or marriages in 2021 with a daily average of 5 marriages. January, May, June and August ranked second with a daily average of 3 marriages.
Table3. Number and Daily Average of Registered Marriages by Month,
Kalinga: 2021
| Month of Registration | Number | Daily Average |
|---|---|---|
| Kalinga | 863 | 2 |
| January | 79 | 3 |
| February | 26 | 1 |
| March | 61 | 2 |
| April | 74 | 2 |
| May | 77 | 3 |
| June | 80 | 3 |
| July | 73 | 2 |
| August | 82 | 3 |
| September | 69 | 2 |
| October | 45 | 2 |
| November | 49 | 2 |
| December | 148 | 5 |
In 2021, the Crude Marriage Rate was 3.76 which means that there were three (3) marriages per 1,000 persons in the province. The highest Crude Marriage Rate was in the municipality of Tinglayan with 11.56 or 11 followed by Tanudan with 8.58 CMR. The municipality of Pinukpuk posted the lowest Crude Marriage Rate of 1.78.
Table4. Number of Registered Marriages and Crude Marriage
Rate by City/Municipality, Kalinga: 2021
| City/Municipality | Number of Live Births | 2020 Population | Crude Marriage Rate |
|---|---|---|---|
| Kalinga | 863 | 229,570 | 3.76 |
| Balbalan | 27 | 12,914 | 2.09 |
| Lubuagan | 62 | 9,323 | 6.65 |
| Pasil | 43 | 10,577 | 4.07 |
| Pinukpuk | 61 | 34,275 | 1.78 |
| Rizal | 69 | 19,554 | 3.53 |
| Tabuk City | 374 | 121,033 | 3.09 |
| Tanudan | 75 | 8,764 | 8.58 |
| Tinglayan | 152 | 13,148 | 11.56 |
Death Statistics
A total of 1, 539 deaths in Kalinga were reported and registered in 2021. The figure indicated an increase of 65.66 or 66 percent death occurrences from the 2020 figure of 929.
Table 5. Number and Percent Distribution of Registered
Deaths by City/Municipality, Kalinga: 2020-2021
| City/Municipality | Registered Deaths | ||
|---|---|---|---|
| 2020 | 2021 | Percent | |
| Kalinga | 929 | 1,539 | 65.66 |
| Balbalan | 49 | 69 | 40.82 |
| Lubuagan | 39 | 63 | 61.54 |
| Pasil | 35 | 48 | 37.14 |
| Pinukpuk | 99 | 151 | 52.53 |
| Rizal | 92 | 125 | 35.87 |
| Tabuk City | 559 | 990 | 77.10 |
| Tanudan | 19 | 33 | 73.68 |
| Tinglayan | 37 | 60 | 62.16 |
The City of Tabuk ranked first in terms of the number of registered deaths in 2021 with 990 or almost two thirds (64.33 percent) of the total registered deaths in the province. Pinukpuk placed second with 151 (9.81 percent) followed by Rizal with 125 8.12 percent).
Figure 5. Number and Percent Distribution of Registered
Deaths by City/Municipality, Kalinga: 2021
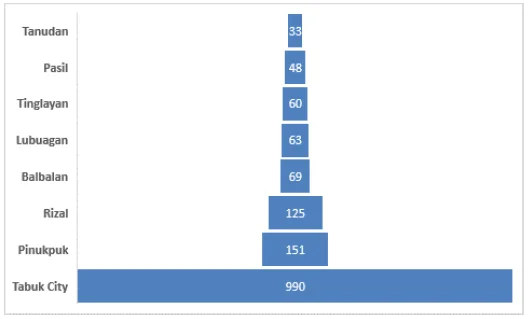
On the other end, the municipality of Tanudan posted the smallest number of registered deaths with 33 or 2.14 percent of the total number of registered deaths in Kalinga in 2021.
On the average, there was a daily occurrence of 4.22 or 4 deaths registered in 2021 in the province.
Mortality was as its peak in September 2021 with a total of 196 registered deaths. It was followed by October with 189 deaths. The month of May and August ranked third and fourth with 147 and 146 registered deaths. The smallest number of registered deaths was in January with 77.
Table6. Number and Daily Average of Registered Deaths
by month, Kalinga: 2021
| Month of Registration | Number | Daily Average |
|---|---|---|
| Kalinga | 1539 | 4.22 |
| January | 77 | 2.48 |
| February | 91 | 3.25 |
| March | 126 | 4.06 |
| April | 123 | 4.10 |
| May | 147 | 4.74 |
| June | 124 | 4.13 |
| July | 102 | 3.29 |
| August | 146 | 4.71 |
| September | 196 | 6.53 |
| October | 189 | 6.10 |
| November | 127 | 4.23 |
| December | 91 | 2.94 |
Crude Death Rate (CDR) for 2021 was computed at 6.70 or 7 deaths per 1,000 persons in the province.
The highest Crude Death Rate was posted in the City of Tabuk City with 8.18 or 8. On the contrary, the smallest Crude Death Rate was recorded in Tanudan with 3.77 or 4.
Table7. Number and Crude Death Rate by City/Municipality,
Kalinga: 2021
| City/Municipality | Number of Live Births | 2020 Population | Crude Death Rate |
|---|---|---|---|
| Kalinga | 1539 | 229,570 | 6.70 |
| Balbalan | 69 | 12,914 | 5.34 |
| Lubuagan | 63 | 9,323 | 6.76 |
| Pasil | 48 | 10,577 | 4.54 |
| Pinukpuk | 151 | 34,275 | 4.41 |
| Rizal | 125 | 19,554 | 6.39 |
| Tabuk City | 990 | 121,033 | 8.18 |
| Tanudan | 33 | 8,764 | 3.77 |
| Tinglayan | 60 | 13,148 | 4.56 |
| Attachment | Size |
|---|---|
|
|
608.96 KB |