Release Date :
Reference Number :
20CAR32-141
Birth Statistics
The number of registered births in Kalinga in 2019 summed up to 6,311 showing a decrease of 467 or 6.89 percent birth occurrences from the 2018 figure of 5,778. During the year, there was a daily birth occurrence of 18 or about six (6) babies born every 8 hours.
Table1. Number and Daily average of Registered Live Births by Month: Kalinga, 2018-2019
| Month of Registration | Number | Daily Average | ||
|---|---|---|---|---|
| 2018 | 2019 | 2018 | 2019 | |
| Kalinga | 6,778 | 6,311 | 19 | 18 |
| January | 463 | 636 | 15 | 21 |
| February | 485 | 469 | 16 | 16 |
| March | 513 | 530 | 17 | 18 |
| April | 495 | 647 | 17 | 22 |
| May | 648 | 535 | 22 | 18 |
| June | 625 | 485 | 21 | 16 |
| July | 661 | 614 | 22 | 20 |
| August | 679 | 542 | 23 | 18 |
| September | 590 | 520 | 20 | 17 |
| October | 643 | 509 | 21 | 17 |
| November | 523 | 445 | 17 | 15 |
| December | 453 | 379 | 15 | 13 |
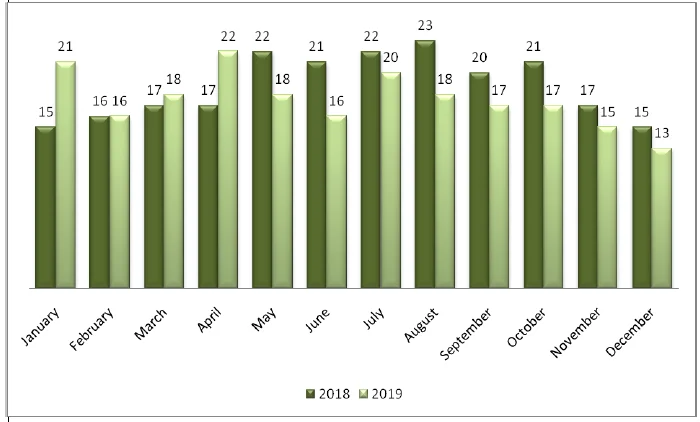
The highest daily average of 22 registered live birth was recorded in the month of April. On the contrary, November and December had the lowest daily average of 15 and 13 registered live births.
Moreover, April was the month with the highest number of registered live births. Births during the month counted to 647 or 10 percent of the total registered births in Kalinga in 2019. On the other end, the lowest number of registered live births was recorded in December with 379 or 60.05 percent.
In 2019, it can be observed that the months of January, March, April, May, July and August posted higher daily average number of registered births than the provincial average.
Figure1. Daily Average of Registered Live Births by Month:
Kalinga, 2018- 2019
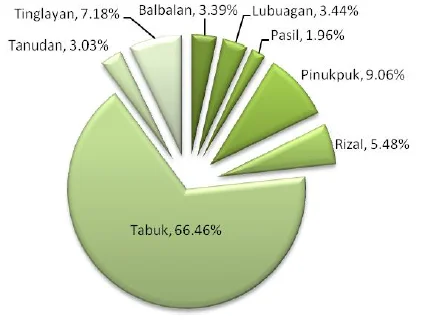
Among the city/municipalities in the province, the highest number of registered births was recorded in the City of Tabuk in 2019. It comprised 4,194 or 66.46 percent of the total births in Kalinga. Pinukpuk ranked second with 572 (9.06 percent) followed by Tinglayan with 453 (7.18 percent), Rizal with 346 (5.48 percent) and Lubuagan with 217 (3.44 percent).
On the other end, Pasil had the lowest number of registered births with 124 (1.96 percent) in 2019.
Figure2. Percent Distribution of Registered Live Births by City/Municipality: Kalinga, 2019
The Crude Birth Rate (CBR) in Kalinga in 2019 was computed at 29.67. This means that there were almost 30 live births per 1,000 persons in the province. The highest crude birth rate was computed in Tabuk City with 37.91 or 38 live births for every 1,000 persons in the city while the lowest was in Pasil with 13 live births for every 1,000 persons.
| City/Municpality | Number of Live Births | 2015 Population | Crude Birth Rate |
|---|---|---|---|
| Kalinga | 6,311 | 212,680 | 29.67 |
| Balbalan | 214 | 12,195 | 14.55 |
| Lubuagan | 217 | 8,733 | 24.85 |
| Pasil | 124 | 9,644 | 12.86 |
| Pinukpuk | 572 | 32,026 | 17.86 |
| Rizal | 346 | 17,038 | 20.31 |
| Tabuk City | 4,194 | 110,642 | 37.91 |
| Tanudan | 191 | 9,534 | 20.03 |
| Tinglayan | 453 | 12,868 | 35.20 |
Marriage Statistics
There were 1, 183 marriages registered in 2019 showing a decrease of 64 from the previous year’s registered figure of 1,247.
One half or 4 out of 8 city/municipalities have decreasing number of registered marriages in 2019. The biggest decrease was noted in the city of Tabuk from 655 to 543 marriages or 17.10 percent.
On the contrary, Rizal posted the highest increase from 132 to 154 (16.67 percent) registered marriages followed by Lubuagan from 40 to 57 (42.50 percent).
Figure3. Number of Registered Marriages by City/Municipality, Kalinga: 2018-2019
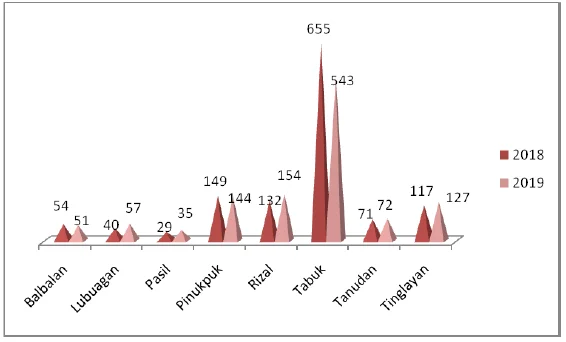
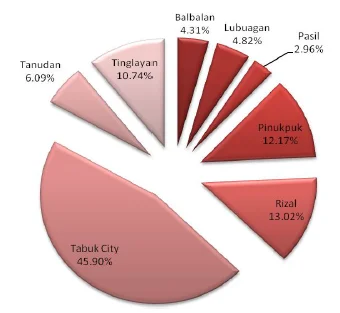
Although the number of registered marriages in the City of Tabuk went down to 543 in 2019 from 655 in 2018, it remained as the city/municipality with the most number of registered marriages in the province. On the other end, the municipality of Pasil posted the least of registered marriages in 2019 with 35 (20.69 percent) followed by Balbalan and Lubuagan with 51 and 57 registered marriages respectively.
Figure4. Percent Distribution of Registered Marriages by City/Municipality, Kalinga: 2019
The month of May was the favorite month of couples to tie the knot in 2018 with a daily average of 7 marriages. April and January ranked second and third with a daily average of 5 marriages. The month of September, October November and March was the least favoured schedule for marriage.
Table3. Number and Daily Average of Registered Marriages by Month, Kalinga: 2019
| Month of Registration | Number | Daily Average |
|---|---|---|
| Kalinga | 1,183 | 3 |
| January | 158 | 5 |
| February | 79 | 3 |
| March | 75 | 3 |
| April | 142 | 5 |
| May | 207 | 7 |
| June | 99 | 3 |
| July | 95 | 3 |
| August | 74 | 2 |
| September | 46 | 2 |
| October | 52 | 2 |
| November | 70 | 2 |
| December | 86 | 3 |
In 2019, the Crude Marriage Rate was 5.56 which mean that there were five (5) marriages per 1,000 persons in the province. The highest Crude Marriage Rate was in the municipality of Tinglayan with 9.87 or 9 followed by Rizal with 9.04 CMR. The municipality of Pasil posted the lowest Crude Marriage Rate of 3.63.
Table4. Number of Registered Marriages and Crude Marriage
Rate by City/Municipality, Kalinga: 2019
| City/Municpality | Number of Marriages | 2015 Population | Crude Marriage Rate |
|---|---|---|---|
| Kalinga | 1,183 | 212,680 | 5.56 |
| Balbalan | 51 | 12,195 | 4.18 |
| Lubuagan | 57 | 8,733 | 6.53 |
| Pasil | 35 | 9,644 | 3.63 |
| Pinukpuk | 144 | 32,026 | 4.50 |
| Rizal | 154 | 17,038 | 9.04 |
| Tabuk City | 543 | 110,642 | 4.91 |
| Tanudan | 72 | 9,534 | 7.55 |
| Tinglayan | 127 | 12,868 | 9.87 |
Death Statistics
A total of 1, 009 deaths in Kalinga were reported and registered in 2019. The figure indicated an increase of 9.67 or 10 percent death occurrences from the 2018 figure of 920.
Table5. Number and Percent Distribution of Registered
Deaths by City/Municipality, Kalinga: 2018-2019
| City/Municpality | Registered Deaths | ||
|---|---|---|---|
| 2018 | 2019 | Percent | |
| Kalinga | 920 | 1,009 | 9.67 |
| Balbalan | 55 | 30 | (45.45) |
| Lubuagan | 28 | 41 | 46.43 |
| Pasil | 37 | 43 | 16.22 |
| Pinukpuk | 86 | 100 | 16.28 |
| Rizal | 82 | 88 | 7.32 |
| Tabuk City | 568 | 651 | 14.61 |
| Tanudan | 17 | 14 | (17.65) |
| Tinglayan | 47 | 42 | (10.64) |
The City of Tabuk ranked first in terms of the number of registered deaths in 2019 with 651 or almost two thirds (64.52 percent) of the total registered deaths in the province. Pinukpuk placed second with 100 (9.91 percent) followed by Rizal with 88 (88.72 percent).
On the other end, the municipality of Tanudan posted the smallest number of registered deaths with 14 or 1.39 percent of the total number of registered deaths in Kalinga in 2019.
Figure5. Number and Percent Distribution of Registered Deaths by City/Municipality, Kalinga: 2019
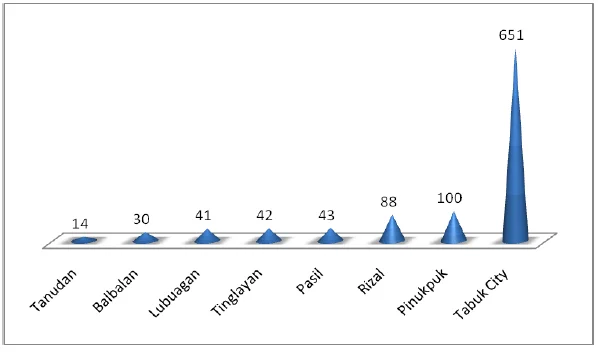
On the average, there was a daily occurrence of 2.76 or 3 deaths registered in 2019 in the province.
Mortality was as its peak in January 2018 with a total of 106 registered deaths. It was followed by November and October with 104 and 103 respectively. The month of September and December ranked fourth with 88 and 87 registered deaths. The smallest number of registered deaths was in May with 63.
Table6. Number and Daily Average of Registered Deaths
by month, Kalinga: 2019
| Month of Registration | Number | Daily Average |
|---|---|---|
| Kalinga | 1,009 | 3 |
| January | 106 | 3 |
| February | 64 | 2 |
| March | 84 | 3 |
| April | 72 | 2 |
| May | 63 | 2 |
| June | 81 | 3 |
| July | 73 | 2 |
| August | 84 | 3 |
| September | 88 | 3 |
| October | 103 | 3 |
| November | 104 | 3 |
| December | 87 | 3 |
Crude Death Rate (CDR) for 2019 was computed at 4.74 or 4 deaths per 1,000 persons in the province.
The highest Crude Death Rate was posted in the province’s capital town, the City of Tabuk with 5.88 or 6. On the contrary, the smallest Crude Death Rate was recorded in Tanudan with 1.47 or 2.
Table7. Number and Crude Death Rate by City/Municipality,
Kalinga: 2019
| City/Municpality | Number of Deaths | 2015 Population | Crude Death Rate |
|---|---|---|---|
| Kalinga | 1,009 | 212,680 | 4.74 |
| Balbalan | 30 | 12,195 | 2.46 |
| Lubuagan | 41 | 8,733 | 4.69 |
| Pasil | 43 | 9,644 | 4.46 |
| Pinukpuk | 100 | 32,026 | 3.12 |
| Rizal | 88 | 17,038 | 5.16 |
| Tabuk City | 651 | 110,642 | 5.88 |
| Tanudan | 14 | 9,534 | 1.47 |
| Tinglayan | 42 | 12,868 | 3.26 |

