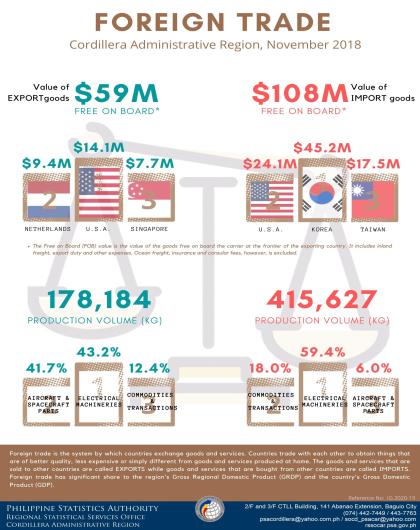
Foreign trade is the system by which countries exchange goods and services. Countries trade with each other to obtain things that are of better quality, less expensive or simply different from goods and services produced at home. The goods and services that are bought from other countries are called imports. Foreign trade has a significant share of the region’s Gross Regional Domestic Product and the country’s Gross Domestic Product.
Foreign Trade: Imports
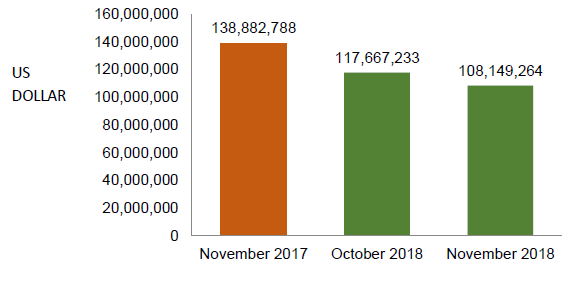
- The Free on Board (FOB) value of import goods of the Cordillera Administrative Region (CAR) in November 2018 was recorded at $108,149,264. Imports showed a decline as compared to $138,882,788 recorded foreign purchase in the same period in the previous year. The value of imports dropped by 8.1 percent from the amount of $117,667,233 recorded in October 2018.
Figure 1. Free on-Board Value of Imports, CAR:
November 2017, October 2018, November 2018
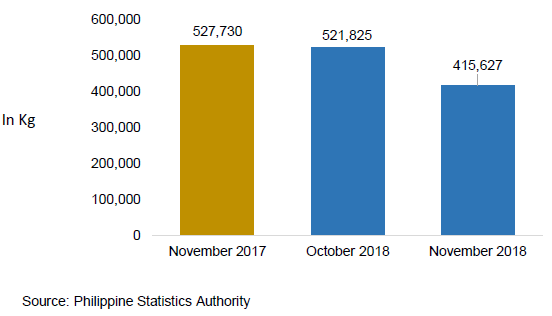
- In November 2018, the region’s total volume of consumption was recorded at 415,627.02 kilograms (kg). Imports volume largely declined as compared to the volume of 527,730.39 kg consumed in same month last year, and decreased by 19.0 percent as compared to 521,825 kg produced in October 2018.
Figure 2. Consumption Volume of Imports, CAR:
November 2017, October 2018, November 2018
Imports by Commodity
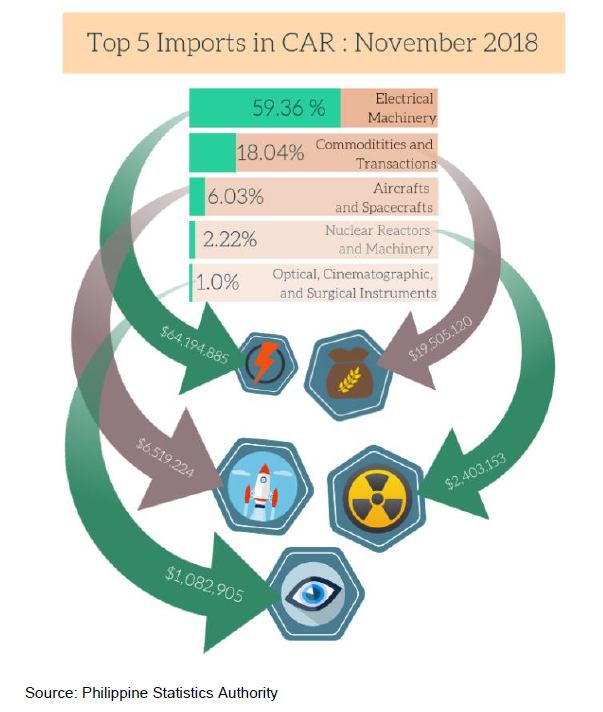
- Electrical machinery and equipment and parts thereof, accounting for 59.4 percent of the total FOB posted a decrease of 9.4 percent from $70,834,639 in 2017 to $64,194,885 in November 2018.
- Commodities and transactions not classified elsewhere ranked second with 18.8 percent share of the total FOB worth $19,505,120 lower by 21.2 percent from $24,747,741 in 2017.
- Aircraft, spacecraft, and parts thereof ranked third at 15.8 percent share and posted a decrease of 4.6 percent equivalent to $16,391,204 in November 2018 from $17,185,716 recorded value in November 2017.
- Nuclear reactors, boilers, machinery and mechanical appliance ranked fourth with 2.3 percent share, decreasing by 54.7 percent, or to $2,403,153 in November 2018 from $5,299,763 in November 2017.
- Optical, photographic, cinematographic, measuring, checking, precision, medical or surgical instruments and apparatus ranked fifth, comprising 1.0 percent of the total imports, decreased by 95.0 percent from $15,565,364 in November 2017 to $1,082,905 in November 2018.
Figure 3. Top 5 Imports, CAR: November 2018 (In USD)
Imports by Country
- The country’s top ten sources of imports for November 2018 posted a total import value of $112,999,346 or 96.0 percent of the total trade.
- Korea was the region’s top source of imports in November 2018, accounting for a total of $45,212,417 or 41.8 percent of the total value of imports. Majority of the imported products from Korea were electrical machinery and equipment and parts thereof; sound recorders and reproducers, television image and sound recorders and reproducers and parts and accessories of such articles billed at $42,597,107 or 39.4 percent and commodities and transactions not classified elsewhere (reserved for special uses by contracting parties) with $1,631,952 or 1.5 percent.
- USA ranked as the region’s second largest source of imports with a total import worth of $24,072,635 or 22.3 percent of the total FOB. Imported goods purchased from USA consisted of aircraft, spacecraft, and parts thereof worth $8,275,094 or 7.7 percent of the region’s total imports. Electrical machinery and equipment and parts thereof; sound recorders and reproducers, television image and sound recorders and reproducers and parts and accessories of such articles ranked the second highest import from USA with total value of $6,392,399 or 5.9 percent of the region’s total imports.
- Taiwan ranked third accounting $17,495,608 or 16.2 percent of total imports in November 2018. Major imports from Taiwan were commodities and transactions not classified elsewhere (reserved for special uses by contracting parties) with purchases worth $10,489,225 or 9.7 percent of the total. Electrical machinery and equipment and parts thereof; sound recorders and reproducers, television image and sound recorders and reproducers and parts and accessories of such articles came second, and valued at $6,417,207 or 5.9 of the total regional imports.
- Japan ranked as fourth top source of import goods with a total value of $7,262,588 or 6.7 percent of the total FOB. Electrical machinery and equipment and parts thereof; sound recorders and reproducers, television image and sound recorders and reproducers and parts and accessories of such articles with import bill of $5,375,708 or 4.97 percent and commodities and transactions not classified elsewhere (reserved for special uses by contracting parties) worth $388,563 or 0.36 percent share were the major imports from Japan.
- China ranked as the fifth top import source of the region with a total imports value amounting to $3,533,920 or 3.3 percent. The top import goods from China were electrical machinery and equipment and parts thereof; sound recorders and reproducers, television image and sound recorders and reproducers and parts and accessories of such articles amounting $1,478,319 or 1.4 percent and aircraft, spacecraft, and parts thereof amounting $1,181,825 or 1.1 percent.
Figure 4. Top 10 Country of Source of Imports, CAR:
November 2018