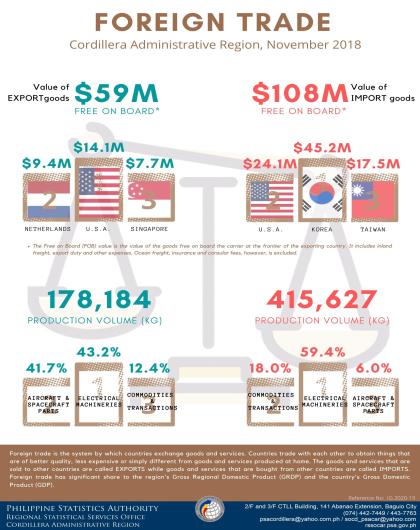
Foreign trade is the system by which countries exchange goods and services. Countries trade with each other to obtain things that are of better quality, less expensive or simply different from goods and services produced at home. The goods and services that are sold to other countries are called exports. Foreign trade has a significant share of the region’s Gross Regional Domestic Product (GRDP) and the country’s Gross Domestic Product (GDP).
Exports at $68.5 million
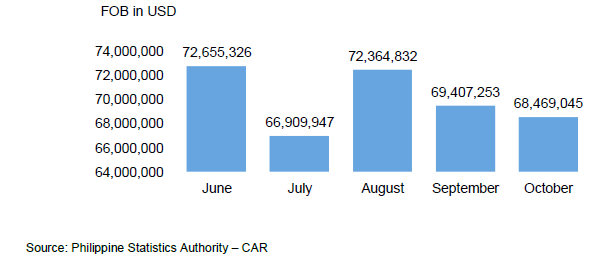
- The Free on Board (FOB) value of export goods of the Cordillera Administrative Region (CAR) in October 2018 was recorded at $68,469,045. This reflects a drastic decrease of 50.9 percent compared to exports value of $139,479,583 in same month last year.
- Likewise, exports value posted a decrease of 1.4 percent from the amount of $938,208 recorded last September 2018. Figure 1 shows the Free On Board Value of Exports for five periods.
Figure 1. Free on Board Value of Exports, CAR:
June to October 2018
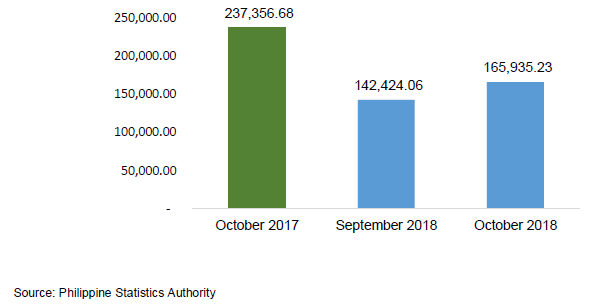
- In October 2018, the region’s total volume of production was recorded at 165,935 kilograms (kg). The volume of exports drastically declined as well compared to the 237,357 kg produced in same month last year, and increased by 16.5 percent compared to October 2018.
Figure 2. Exports Production Volume, CAR:
October 2017, September 2018 and October 2018
Exports by Commodity
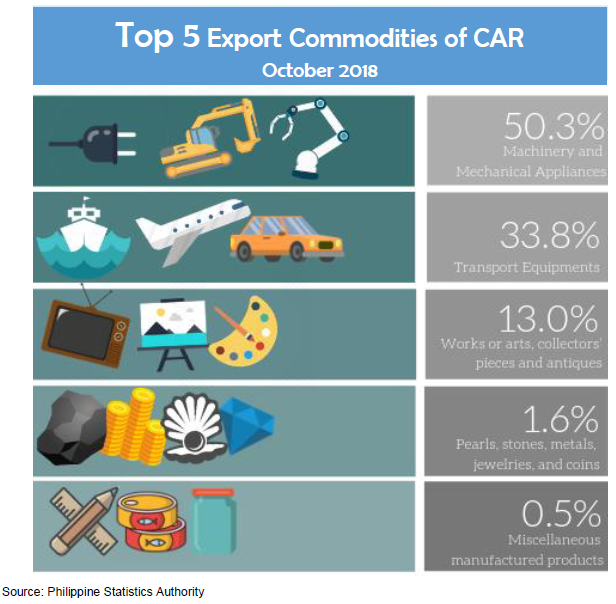
- Among the export commodities, machinery and mechanical appliances; electrical equipment; parts thereof; sound recorders and reproducers, and parts and accessories of such articles were largely produced for the month of October 2018, accounting for 55.3 percent of export goods in September and 50.3 percent in October. These were valued at $38,413,066 and $34,422,848 in September and October 2018, respectively.
- Meanwhile, vehicles, aircraft, vessels and associated transport equipment shared 33.8 percent in the total exports of the region in October 2018. These were valued at $23,149,251 in export sales.
- Works or arts, collectors’ pieces and antiques ranked as third highest produced commodity with 13 percent share in the total exports of the region amounting to $8,917,313.
- Next to it was Natural or cultured pearls, precious or semi-precious stones, precious metals, metals clad with precious metals and articles thereof; imitation jewelry; coin with 1.6 percent share in the export valued at $1,069,461.
- Furthermore, Miscellaneous manufactured articles placed fifth with a share amounting to $310,391 or 0.5 percent in the total export. Table 1 shows the exports production, FOB Value and Percentage share of commodity for October 2018 in CAR.
- Commodities such us raw hides and skins, leathers (0.4), base metals (0.2), plastics and articles thereof (0.1), optical, photographic, cinematographic, measuring (0.09), articles of stone, plaster, cement (0.03), textiles and textile articles (0.02), and miscellaneous chemical products (0.01) shared 0.9 percent to the total value of exports. These translated to a total of 16,993 kg with total value of $599,781.
Figure 3. Top 5 Export Commodities, CAR:
October 2018
Country of Destination
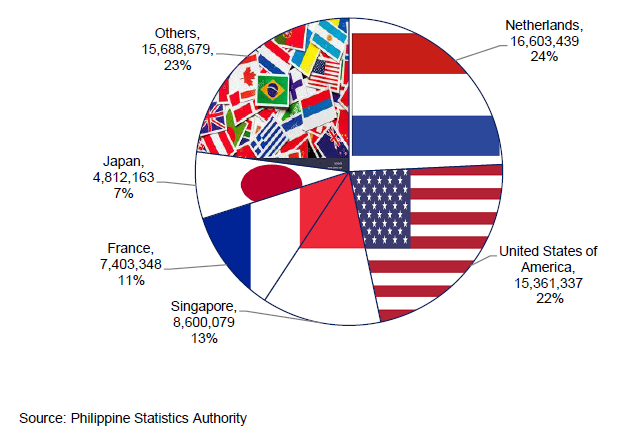
- The region mostly exported to the Netherlands in October 2018 with 24.2 percent share equivalent to $16,603,439. It was followed by United States of America (USA) with 22.4 percent or equivalent to $15,361,337 in exports receipts.
- Singapore came third with total value of goods amounting to $8,600,079 in October 2018. The total value of exports to France amounted to $7,403,348 (11%).
- The region also exported to Japan with exports value of $4,812,163 (7%) and to other countries with aggregated value of $15,688,679 (23%).
Figure 4. Country of Destination of Exports Goods, CAR:
October 2018
Technical Notes
-
Free on Board Value - is the value of the goods free on board the carrier at the frontier of the exporting country. It includes inland freight, export duty and other expenses. Ocean freight, insurance and consular fees, however, is excluded. These FOB values are obtained directly from the source documents. However, for cases where the FOB values declared in the source documents are not in US dollars, these values are converted to US dollars. The average US dollar rate for the month which is computed as the total daily rate of transactions divided by the number of working days in a month is used in converting FOB value to FOB US dollar value.
-
Country of Destination (Exports only) - it is the country of ultimate destination/shipment. It is not necessarily the country where the commodity/shipment is to be unloaded, as in the case of shipment unloaded from one ocean liner but is destined to a country that is landlocked. In which case, the country of destination is the landlocked country.
-
Country of Origin (Imports only) - it is the country where the commodity is mined, grown, or manufactured. Further processing or material added to it in another country must bring about a material transformation to render such country as the country of origin. The country of origin remains unchanged if the commodity is subjected to mere sorting, grading, cleaning, packaging or similar processing.
-
Exports - the goods and services that are sold to other countries.
-
Imports - the goods and services that a country buys from other countries.
-
Philippine Standard Commodity Classification - is used to classify the imported commodities at the most detailed level for statistical purposes.
-
Sources of Information - foreign trade statistics are compiled by the National Statistics Office, now the Philippine Statistics Authority, from copies of import and export documents submitted by importers and exporters or their authorized representatives to the Bureau of Customs as required by law.