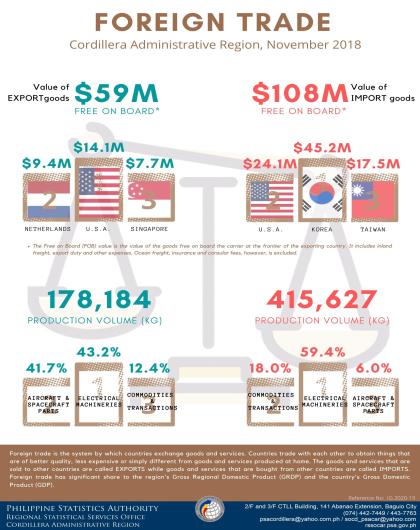
Foreign trade is the system by which countries exchange goods and services. Countries trade with each other to obtain things that are of better quality, less expensive or simply different from goods and services produced at home. The goods and services that are sold to other countries are called exports. Foreign trade has a significant share of the region’s Gross Regional Domestic Product and the country’s Gross Domestic Product.
Exports at $59.2 million
-
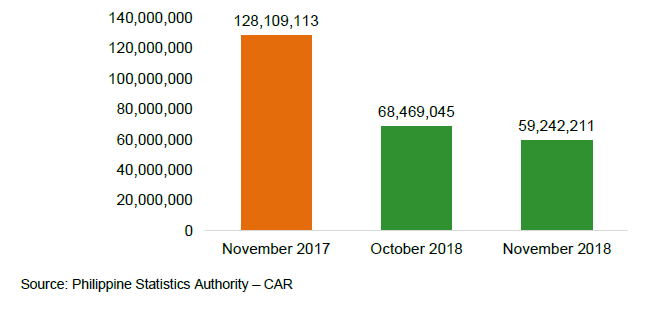
The Free on Board (FOB) value of export goods of the Cordillera Administrative Region (CAR) in November 2018 was recorded at $59,242,211. The volume of exports showed a drastic decrease by 53.8 percent as compared to the same period in the previous year with recorded value of $128,109,113.
-
Comparing the FOB of the region in November 2018 to October 2018, the exports value decreased by 13.5 percent.
Figure 1. Free on Board Value of Exports, CAR:
November 2017, October 2018, November 2018
(in US Dollars)
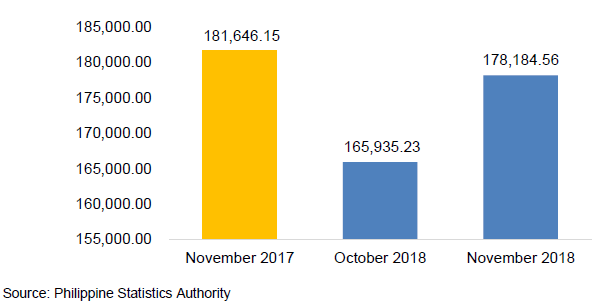
- In November 2018, the region’s total volume of production was recorded at 178,184 kilograms (kg). Export volume declined by 2.1 percent as compared to the total volume of 181,646 kg exported in November 2017, and increased by 7.4 percent from the volume of exports in October 2018.
Figure 2. Exports Production Volume, CAR:
November 2017, October 2018 and November 2018
(in Kilograms)
Exports by Commodity
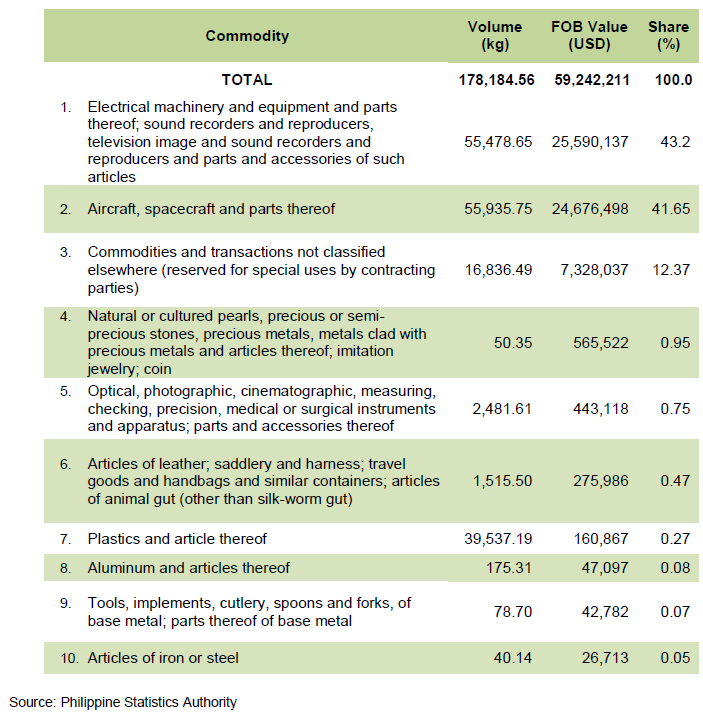
- Among the export commodities, electrical machinery and equipment and parts thereof; sound recorders and reproducers, television image and sound recorders and reproducers and parts and accessories of such articles were largely produced for the month of November 2018, accounting for 43.2 percent of export goods. These were valued at $25,590,137.
- Meanwhile, aircraft, spacecraft and parts thereof ranked as second with 41.65 percent share in the total exports of the region in November 2018. These were valued at $24,676,498 in export sales.
- Commodities and transactions not classified elsewhere (reserved for special uses by contracting parties) ranked as third highest produced commodity with 12.4 percent share in the total exports of the region amounting to $7,328,037.
- This was followed by natural or cultured pearls, precious or semi-precious stones, precious metals, metals clad with precious metals and articles thereof; imitation jewelry; coin with 1.0 percent share in the regional export and valued at $565,522.
- Furthermore, optical, photographic, cinematographic, measuring, checking, precision, medical or surgical instruments and apparatus; parts and accessories thereof placed fifth with a share amounting to $443,118 or 0.8 percent in the total export sales of the region.
- Commodities such us articles of leather; saddlery and harness; travel goods and handbags and similar containers; articles of animal gut (other than silk-worm gut) (0.47), plastics and articles thereof (0.27), aluminum and articles thereof (0.08), tools, implements, cutlery, spoons and forks, of base metal (0.07) and articles of iron and steel (0.05) shared 0.9 percent to the total exports sales receipt of the region. These translated to a total of 41,346.84 kg with total value of $553,445.
Table 1. Export Commodities, CAR: November 2018
Country of Destination
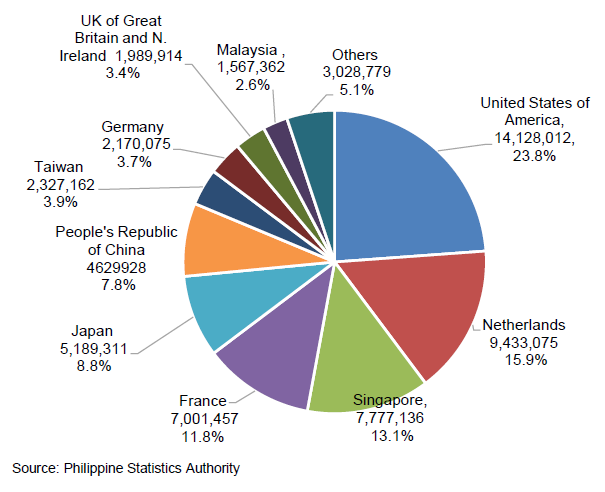
- The country where the region exported the most in November 2018 was United States of America with total exports value of $14,128,012, followed by Netherlands with $9,433,075 exports receipts, sharing 15.9 percent of the total export sales of the region.
- The region also exported to countries namely, Singapore (13.1%), France (11.8%), Japan (8.8%), Peoples Republic of China (7.8%), Taiwan (3.7%), Germany (3.5%), UK of Great Britain and N. Ireland (3.2%), Malaysia (2.5%).
- Other countries include Hongkong (2.6%), UAE (0.5%), Israel (0.5%), Canada (0.4%), Republic of Korea (0.3%), Thailand (0.2%), Poland (0.1%), Italy (0.1%), India (0.1%), Switzerland (0.04%), Mexico (0.02%), Brazil (0.02%), Australia(0.02%), Sweden(0.01%), Qatar (0.00%) and Turkey (0.00%).
Figure 3. Top 10 Countries of Destination of Exports Goods, CAR:
November 2018 (in US Dollars)