Inbound Tourism Expenditures
- Inbound tourism comprises the activities of a non-resident visitor within the country of reference on an inbound tourism trip.
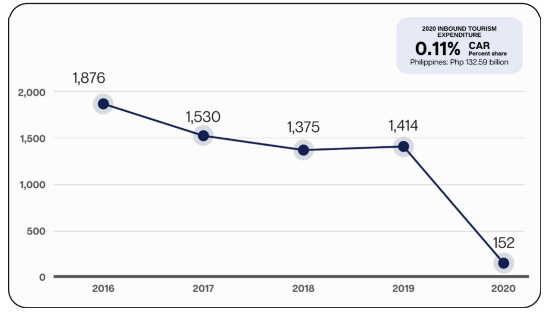
- The inbound tourism expenditures of the Cordillera Administrative Region (CAR) in 2020 amounted to PhP152 million comprising 0.11 percent share of the Philippines' total inbound tourism expenditures.
- The decline of 89.3 percent in 2020 from the PhP1,414 billion in the previous year was due to strict COVID-19 quarantine restrictions and international travel bans.
Figure 1. Inbound Tourism Expenditures, CAR: 2016-2020
In Million Philippine Peso, At Current Prices
 Source: Philippine Statistics Authority - RSSO CAR
By Type of Inbound Tourism
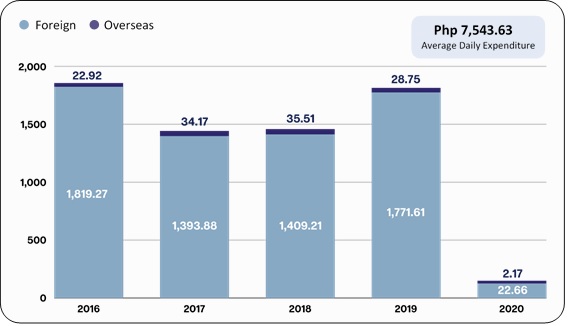
- The Cordillera Administrative Region (CAR) recorded tourism expenditures of more than 90 percent from foreign inbound tourists, which amounted to PhP22.7 million, while PhP2.2 million was from overseas inbound tourists.
- Inbound tourism expenditures from foreign tourists dropped by -98.7 percent from PhP1.77 billion in 2019 to PhP22.7 million in 2020 while overseas inbound tourists dropped by -92.5 percent from PhP28.7 million to PhP2.2 million.
Figure 2. Inbound Tourism Expenditures by Type, CAR: 2016–2020
In Million Philippine Peso, At Current Prices
 Source: Philippine Statistics Authority - RSSO CAR
- From 2017-2019, the average daily expenditures of foreign and overseas inbound tourists steadily increased. In 2020, it was estimated at PhP7,543.63 that was higher by 2.1 percent from PhP7,392.19 the previous year.
By Tourism Product
- The value of expenditures in all industries registered a decline in 2020.
- Among all tourism products, Transportation Services continued to incur the highest expenditures at around PhP52.01 million. In contrast, Entertainment and Recreation Services only amounted to PhP8.82 million in 2020.
- The other products and estimated expenditures were: Accommodation Services for Visitors with PhP38.79 million; Travel Agencies and Other Reservation Services with PhP19.05 million; Country-specific Tourism Characteristic Services (Shopping) with PhP18.39 million; and Food and Beverage Serving Services with PhP15.03 million.
Figure 3. Inbound Tourism Expenditures by Product, Growth rate
(In Percent), CAR: 2019–2020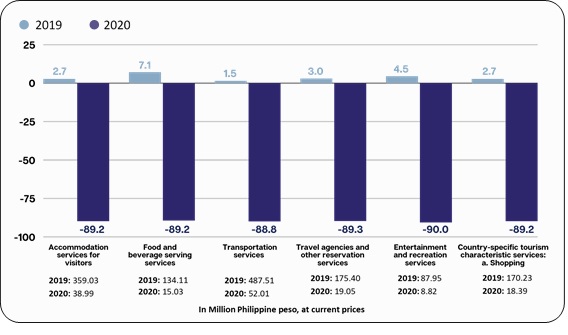 Source: Philippine Statistics Authority - RSSO CAR
- Among the tourism products, Entertainment & Recreation Services recorded the largest decline with -90 percent, followed by Transportation Services with -89.3 percent, and Accommodation Services for Visitors and Country-specific Tourism Characteristic Services (Shopping) both with -89.2 percent.
By Province
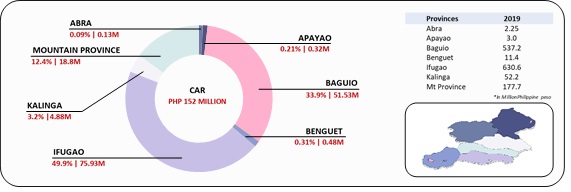
- Among the provinces of CAR, Ifugao contributed the highest percentage of inbound tourism expenditures with nearly half of the total expenditures or PhP75.93 million, while Abra shared the lowest with 0.09 percent or PhP0.13 million.
Figure 4. Inbound Tourism Expenditure by Province
(In percent), CAR: 2020
 Source: Philippine Statistics Authority - RSSO CAR
- Baguio City contributed 33.9 percent share. Mountain Province, Kalinga, Benguet, and Apayao shared 12.4, 3.2, 0.3, and 0.2 percent, respectively.
Abra
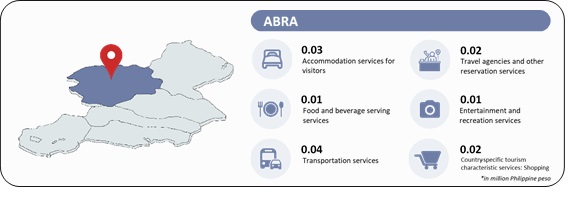
- With only 0.09 percent share, Abra was the least contributor to inbound tourism expenditures of the region. In 2020, the province declined by -94.18 percent from PhP2.25 million last year.
- Among the expenditure items, Abra registered PhP0.04 million for Transportation Services, followed by Accommodation Services for Visitors with PhP0.03 million, Travel Agencies and Other Reservation Services and Country-specific Tourism Characteristic Services (Shopping) both with PhP0.02 million, and Entertainment and Recreation Services together with Food and Beverage Serving Services both contributed the lowest with PhP0.01 million.
Figure 5. Inbound Tourism Expenditures
by Product, Abra: 2020
 Source: Philippine Statistics Authority - RSSO CAR
- All expenditure items in Abra decreased at approximately -94 percent in 2020.
Apayao
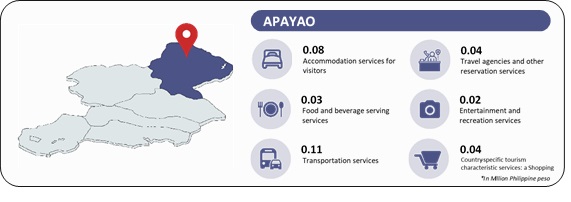
- Apayao province gained a PhP0.32 million inbound tourism expenditures in 2020 which was lower by -89.2 percent from PhP2.96 million the previous year.
Figure 6. Inbound Tourism Expenditures
By Product, Apayao: 2020
 Source: Philippine Statistics Authority - RSSO CAR
- Transportation Services in the province registered the highest expenditures among the tourism characteristic products, amounting to PhP0.11 million. However, Entertainment and Recreation Services recorded the lowest expenditures with PhP0.02 million.
- Entertainment and Recreation Services and Transportation Services had the largest decline with -89.8 and -89.1 percent, respectively.
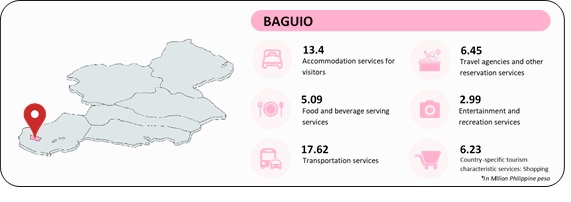
Baguio City
- Baguio City ranked second as the top contributor to inbound tourism expenditures of the region with PhP51.53 million. However, the city recorded a -90.4 percent decline from its PhP537.17 million in 2019.
Figure 7. Inbound Tourism Expenditures
By Product, Baguio: 2020
 Source: Philippine Statistics Authority - RSSO CAR
- Among the tourism characteristic products, Food and Beverage Serving Services posted the lowest decline with -90 percent.
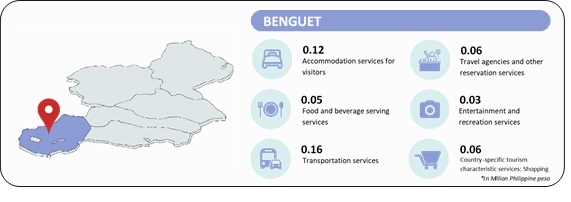
Benguet
- Benguet contributed 0.3 percent or PhP0.48 million to the inbound tourism expenditures of CAR. The province posted a -95.8 percent drop from PhP11.4 million last year.
Figure 8. Inbound Tourism Expenditures
By Product, Benguet: 2020
 Source: Philippine Statistics Authority - RSSO CAR
- Transportation Services, Accommodation Services for Visitors, and Travel Agencies & Other Reservation Services were among the top tourism products in Benguet with 34.2, 25.5, and 12.5 percent shares, respectively
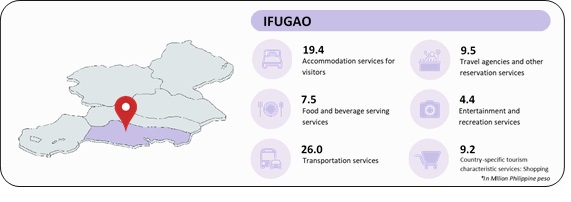
Ifugao
- Among the provinces in CAR, Ifugao province had the highest percentage share to the region’s total inbound tourism expenditures with 49.9 percent or about PhP75.9 million. Also, Ifugao had the lowest decline rate with -88 percent.
Figure 9. Inbound Tourism Expenditures
By Product, Ifugao: 2020
 Source: Philippine Statistics Authority - RSSO CAR
- In 2020, Ifugao attained the highest inbound tourism expenditures on Transportation Services among other provinces, with more than 50 percent share.
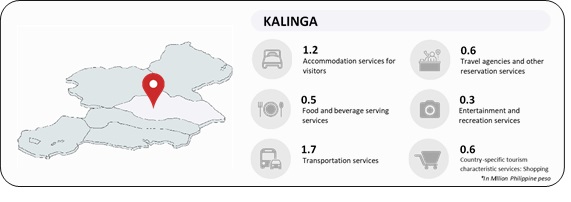
Kalinga
- The province of Kalinga contracted at least PhP4.9 million inbound expenditure in 2020, which was lower by 90.7 percent from its PhP52.2 million last year.
- The province posted PhP1.7 million expenditures for Transportation Services, followed by Accommodation Services for Visitors with PhP1.2 million. The other tourism products only amounted to thousands of pesos.
Figure 10. Inbound Tourism Expenditures
By Product, Kalinga: 2020
 Source: Philippine Statistics Authority - RSSO CAR
- Most of the expenditure items in Kalinga province declined by approximately -90 percent.
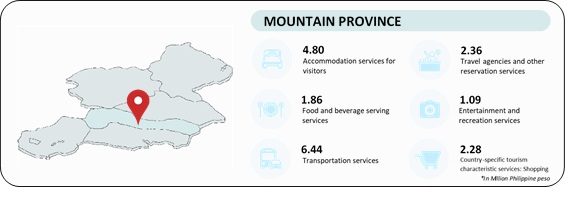
Mountain Province
- Mountain Province was one of the top contributors to inbound tourism expenditures of the region for 2020. The province recorded PhP18.83 million expenditures, which declined by -89.4 percent from its PhP177.3 million the previous year.
- Transport Services in the province had the highest portion of expenditure among the tourism products, which accounted for PhP6.44 million or 34.2 percent of the total. Meanwhile, Entertainment and Recreation Services registered the lowest with PhP1.09 million or 5.8 percent share.
Figure 11. Inbound Tourism Expenditures
By Product, Mountain Province: 2020
 Source: Philippine Statistics Authority - RSSO CAR
- Food and Beverage Serving Services had the lowest decrease among the products in the province with -89 percent.