

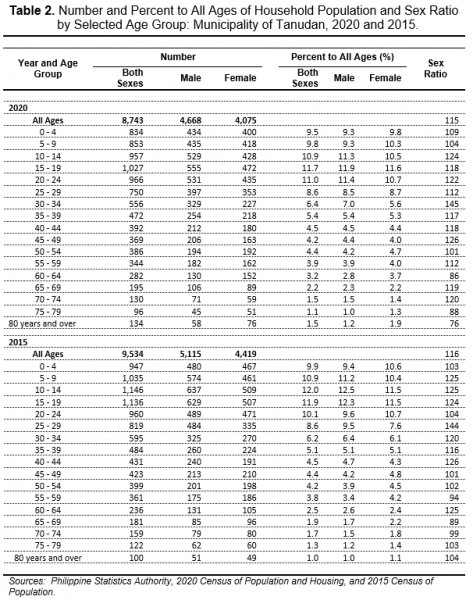
Based on the 2020 Census of Population and Housing (2020 CPH), the Municipality of Tanudan had a Total Population of 8,746 persons. Of this total, the Household Population comprised 99.96 percent or 8,743 persons.
Of the 8,743 Household Population in 2020, 4,668 (53.39%) were males while 4,075 (46.60%) were females. By age group, 2,644 (30.24%) were under 15 years of age (young dependents). On the other hand, persons aged 15 to 64 years (working-age or economically-active population) totaled to 5,544 (63.41%) while those in age groups 65 years and over (old dependents) comprised the remaining 555 (6.34%). In 2015, persons aged 0 to 14 years, 15 to 64 years, and 65 years and over accounted for 32.81, 61.30 and 5.89 percent respectively, of the Household Population
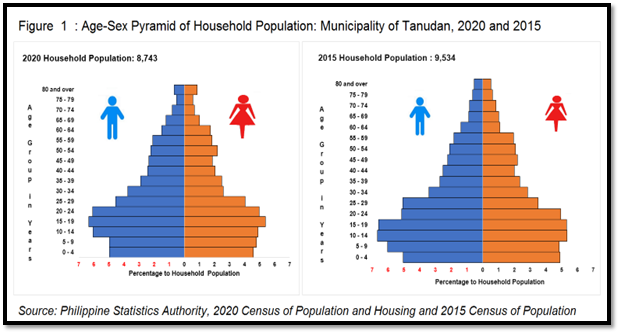
Moreover, there were more males (91.22%) than females (89.52%) among the 0 to 59 age group. Meanwhile, among the older age group (60 years and over), females (10.48%) outnumbered the males (8.78%). The same trend was also observed in 2015.
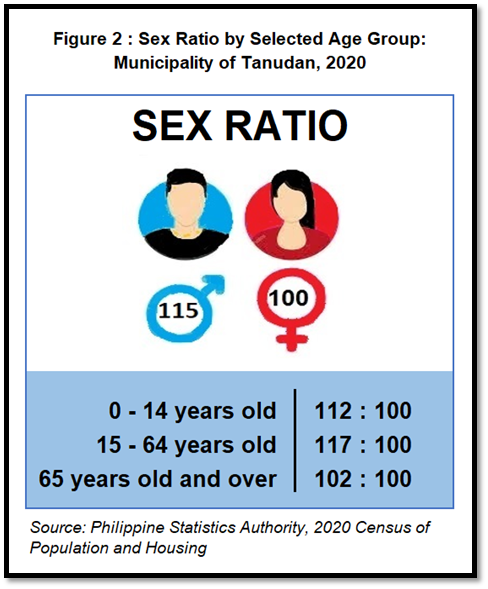
Sex ratio stands at 115 males per 100 females
The sex ratio in the Municipality of Tanudan was computed at 115 in 2020. This means that there were 115 males for every 100 females. While in 2015, the sex ratio was at 116 males per 100 females.
In 2020, children aged below 15 years had a sex ratio of 112 males per 100 females, while those aged 15 to 64 years had a sex ratio of 117 males per 100 females. Moreover, among those aged 65 years and over, the sex ratio was 102 males per 100 females (Figure 2)
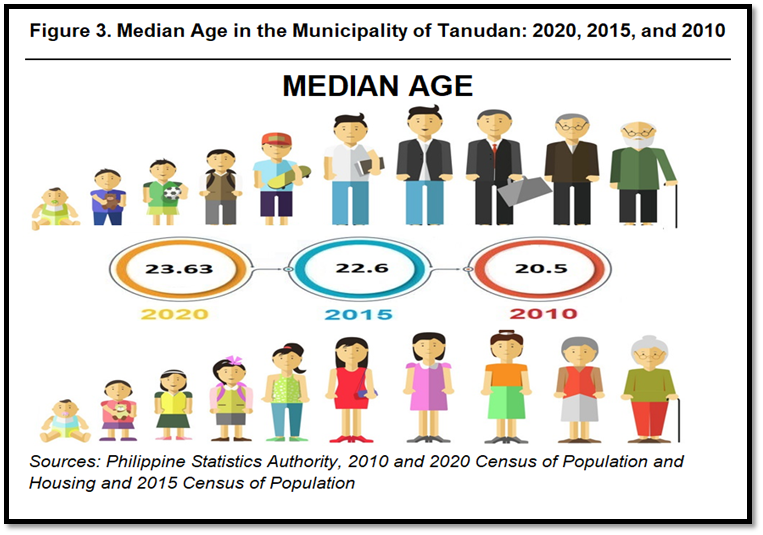
Median age increases to 23.63 years
The median age of the Household Population of the Municipality of Tanudan continues to rise during the past three decades. In 2020, the median age was computed at 23.63 years, which means that half of the household population was younger than 23.63 years, while the other half is older than 23.63 years. This is higher than the median ages of 22.6 years and 20.5 years that were posted in 2015 and 2010, respectively. (Figure 3)
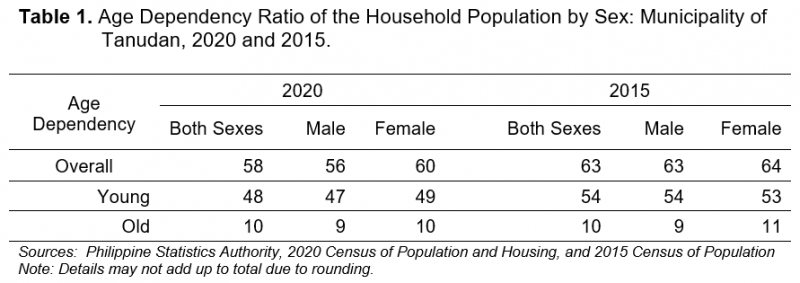
Dependency ratio declines to 58 dependents per 100 persons in the working-age group
The overall dependency ratio of the Municipality of Tanudan was computed at 58, which indicates that for every 100 working-age or economically-active population, there were about 58 dependents (48 young dependents and 10 old dependents). This is lower than the dependency ratio in 2015, which was recorded at 63 dependents per 100 working-age population (54 young dependents and 10 old dependents). (Table 1)
There are more males than females in children under five years old
Children below five years old comprised 9.5 percent (834 persons) of the Household Population which is lower than the 9.9 percent (947 persons) posted in 2015. The sex ratio in 2020 and 2015 were computed at 109 and 103 males per 100 females respectively. (Table 2)
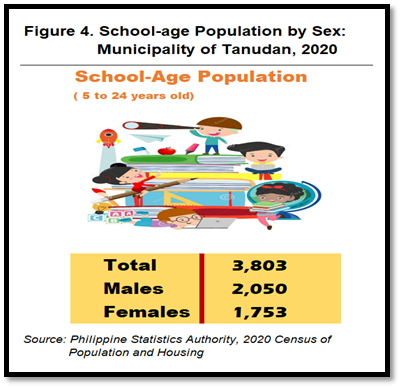
About three in every seven household population are of school age
In 2020, the school-age population (5 to 24 years old) accounted for 3,803 (43.49%) of the 8,743 Household Population compared to the 4,277 (44.86%) school-age population that was reported in 2015. (Table 2 and Figure 4)
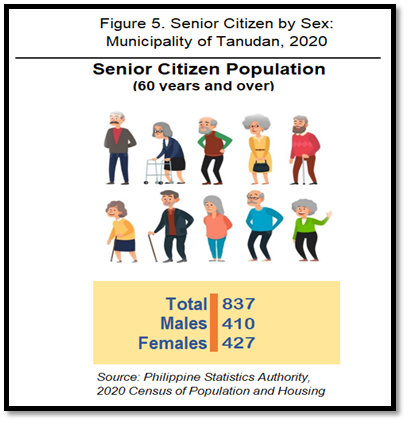
Senior citizens constitute about 9.57 percent of the Household Population
In the Municipality of Tanudan, people aged 60 years old and over are regarded as senior citizens. They made up 9.57 percent (837 persons) of the Household Population in 2020, higher than the 8.37 percent (798 persons) recorded in 2015. There were more females (51.02%) than males (48.98%) among the senior citizens, in 2020. (Table 2 and Figure 5)
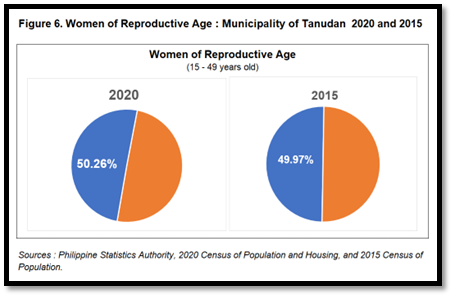
More than half of the female population are of reproductive age
Women of reproductive age (15 to 49 years old) totaled to 2,048 or 50.26 percent of the 4,075 female household population in 2020. These figures were higher compared with the 49.97 percent (2,208 females) posted in 2015. (Table 2 and Figure 6)
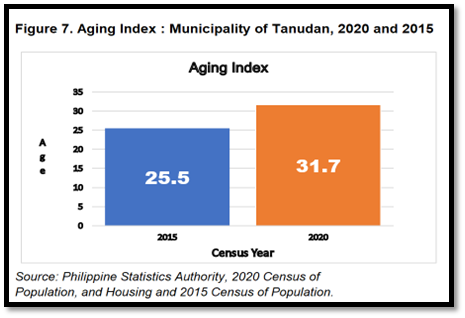
Aging index increases by 6.2 points from 25.5 in 2015 to 31.7 in 2020
In the Municipality of Tanudan, the aging index or the proportion of persons aged 60 years and over per 100 persons under the age of 15 years was computed at 31.7 percent in 2020. This means that there are about three persons aged 60 years and over for every ten children under 15 years old. In 2015, the aging index was 6.2 points lower at 25.5 percent. (Table 2 and Figure 7)
Approved for Release:
RANDOLF M. LADERAS
(Supervising Statistical Specialist)
Officer-in-Charge
TECHNICAL NOTES
The Philippine Statistics Authority conducted the 2020 Census of Population and Housing (2020 CPH) in September 2020, with 01 May 2020 as reference date.
The 2020 CPH was the 15th census of population and 7th census of housing that was undertaken in the Philippines since the first census in 1903. It was designed to take inventory of the total population and housing units in the country and collect information about their characteristics.
The Philippine Standard Geographic Codes as of April 2022 was used for the disaggregation of geographic levels of the 2020 CPH.
Definition of Terms and Concepts
Household is a social unit consisting of person or a group of persons who sleep in the same housing unit and have a common arrangement in the preparation and consumption of food.
Household population refers to all persons who are members of the household.
Sex is the biological and physiological reality of being a male or female.
Age refers to the interval of time between the person’s date of birth and his/her last birthday prior to the census reference date. It is expressed in completed years or whole number.
Age-sex structure is the composition of a population as determined by the number or proportion of males and females in each age category. The age-sex structure of a population is the cumulative result of past trends in fertility, mortality, and migration. Information on age-sex composition is essential for the description and analysis of many other types of demographic data.
Population pyramid is a bar chart, arranged vertically, that shows the distribution of a population by age and sex. By convention, the younger ages are at the bottom, with males on the left and females on the right.
Sex ratio is the number of males per one hundred females in a population.
Median age is the age that divides the population into two numerically equal groups; that is, half of the population are younger than this age and the other half are older.
Overall dependency ratio is the number of persons under 15 years old (young dependents) and persons aged 65 and older (old dependents) per one hundred persons 15 to 64 years old (working-age or economically-productive group) in a population.
Aging of population is a process in which the proportions of adults and elderly increase in a population, while the proportions of children and adolescents decrease. This process results in a rise in the median age of the population. Aging occurs when fertility rates decline while life expectancy remains constant or improves at the older ages.
Aging index is calculated as the number of persons 60 years old and over per one hundred persons under the age of 15 years.
