

The household population increased by 8.17 percent
Based on the 2020 Census of Population and Housing, the province of Kalinga had a household population of 229,328 persons as of May 1, 2020. This showed an increase of 17,325 or 8.17 percent from 212,003 persons in 2015 and an increase of 28,122 persons or 13.98 percent from 2010 census figure of 201,206 persons. (Table 1)
Table 1. Household Population of Kalinga
2010, 2015 and 2020
| Census Year | Census Reference Date | Household Population |
|---|---|---|
| 2010 | May 1, 2010 | 201,206 |
| 2015 | August 1, 2015 | 212,003 |
| 2020 | May 1, 2020 | 229,328 |
The City of Tabuk has the largest household population
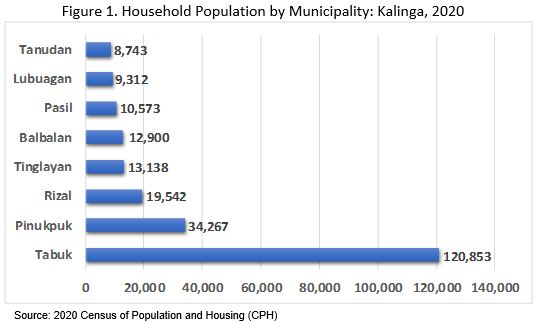
Among the eight (8) city/municipalities of the province, Tabuk City had the biggest share of the province’s household population with 120,853 persons or 52.70 percent in 2020. Pinukpuk came second with 34,267 persons or 14.94 percent. Tanudan has the least household population with 8,743 or 3.81 percent of the total household population in Kalinga. (Figure 1)
Rizal recorded the highest increase in terms of Household Population
In terms of the increase in household population size, Rizal recorded the highest increase of 14.76 percent from 17,028 persons in 2015 to 19,542 persons in 2020. This was followed by City of Tabuk with an increase of 9.83 percent, then Pasil with 9.69 increase. The lowest increase in household population size was observed in Tinglayan at 2.12 percent while municipality of Tanudan remarked a decrease of 8.30 percent from 9,534 persons in 2015 to 8,743 persons in 2020. (Table 2)
Table 2. Household Population by Municipality: Kalinga,
2015 and 2020
| Municipality | Household Population | Percent Change | |
| 2015 | 2020 | ||
| Balbalan | 12,154 | 12,900 | 6.14 |
| Lubuagan | 8,733 | 9,312 | 6.63 |
| Pasil | 9,639 | 10,573 | 9.69 |
| Pinukpuk | 32,014 | 34,267 | 7.04 |
| Rizal | 17,028 | 19,542 | 14.76 |
| City of Tabuk (Capital) | 110,036 | 120,853 | 9.83 |
| Tanudan | 9,534 | 8,743 | -8.30 |
| Tinglayan | 12,865 | 13,138 | 2.12 |
Households in Kalinga increased by 14.16 percent
The number of households for the province of Kalinga in 2020 reached 48,079, an increase of 14.16 percent compared to the number of households of 42,115 in 2015, and increased by 24.42 percent over 2010 with 38,642 households. (Table 3)
Table 3. Number of Households of Kalinga
2010, 2015 and 2020
| Census Year | Census Reference Date | Household Population |
|---|---|---|
| 2010 | May 1, 2010 | 38,642 |
| 2015 | August 1, 2015 | 42,115 |
| 2020 | May 1, 2020 | 48,079 |
53.52 percent of the number of households in Kalinga were in Tabuk City
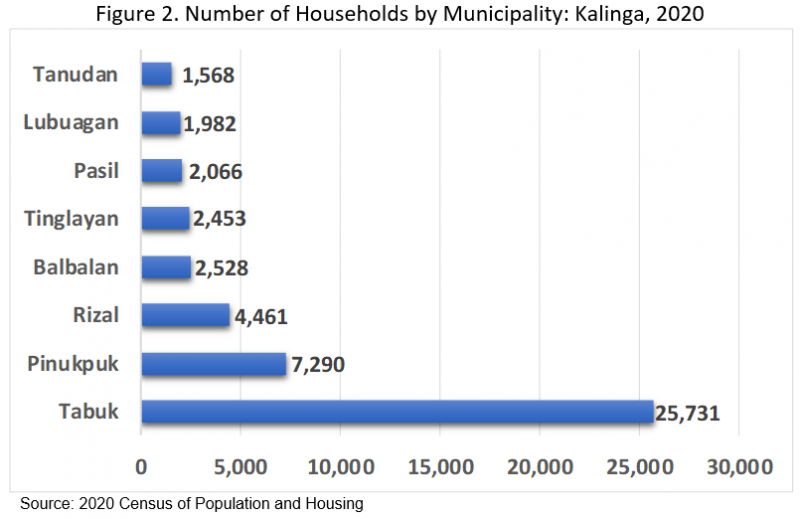
Tabuk City has the highest number of households with 25,731 or 53.52 percent of the total number of households in Kalinga in 2020, followed by Pinukpuk with 7,290 households, Rizal with 4,461 households, Balbalan with 2,528 and the least in terms of household size was Tanudan with 1,568 households or 3.26 percent of the total number of households in Kalinga. (Figure 2)
Rizal has the highest increase in terms of number of households
All the city/municipality of Kalinga increased in household number except the municipality of Tanudan which remain the same as compared to 2015 data with 1,568 households. Rizal has the highest increase with 19.82 percent from 3,723 households in 2015 to 4,461 households in 2020. Pinukpuk ranks second with 16.10 percent, followed by Pasil, Tabuk City, Lubuagan, and Balbalan with 14.78, 14.67, 14.50 and 9.82 percent respectively. The municipality of Tinglayan recorded the least in terms of household increase with 7.92 percent. (Table 4)
Table 4. Number of Households by Municipality: Kalinga,
2015 and 2020
| Municipality | Household Population | Percent Change | |
| 2015 | 2020 | ||
| Balbalan | 2,302 | 2,528 | 9.82 |
| Lubuagan | 1,731 | 1,982 | 14.50 |
| Pasil | 1,800 | 2,066 | 14.78 |
| Pinukpuk | 6,279 | 7,290 | 16.10 |
| Rizal | 3,723 | 4,461 | 19.82 |
| City of Tabuk (Capital) | 22,439 | 25,731 | 14.67 |
| Tanudan | 1,568 | 1,568 | 0 |
| Tinglayan | 2,273 | 2,453 | 7.92 |
Average Household Size of Kalinga decreased by 4.57 percent
The Average Household Size (AHS) of Kalinga in 2020 was 4.80 or 5 members in one (1) household. It remarks a decrease of 4.57 percent over 2015 with 5.03 AHS and 7.87 percent over 2010 with 5.21 AHS. (Table 5)
Table 5. Average Household Size of Kalinga
2010, 2015 and 2020
| Census Year | Census Reference Date | Household Population |
|---|---|---|
| 2010 | May 1, 2010 | 5.21 |
| 2015 | August 1, 2015 | 5.03 |
| 2020 | May 1, 2020 | 4.80 |
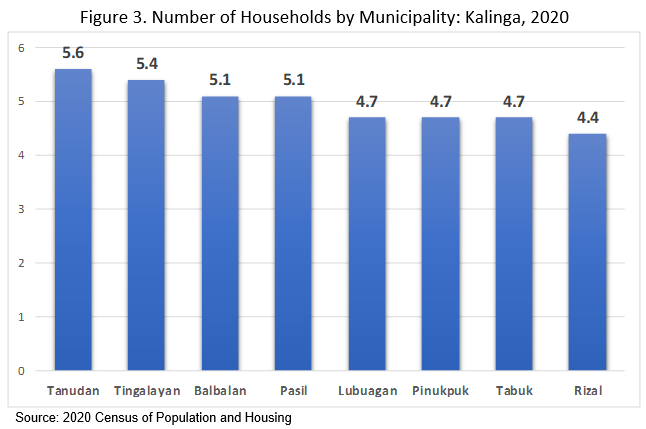
Tanudan has the highest average household size
The municipality of Tanudan has the highest average household size with 5.6 or 6 members in one (1) household, followed by Tinglayan with 5.4 AHS. Balbalan and Pasil rank third with both having an AHS of 5.1. Lubuagan, Pinukpuk and Tabuk rank fourth with the same AHS at 4.7. Rizal observed the least average household size with 4.4 or 4 members in one (1) household. (Figure 3)
Tanudan observed the highest decrease in terms of average household size
All eight (8) city/Municipalities in Kalinga observed a decrease in average household size. Though the municipality of Tanudan has the highest average household size, it was also observed that Tanudan has the highest decrease of 8.20 percent from 6.1 in 2015 to 5.6 in 2020. (Table 6)
Table 6. Average Household Size by Municipality: Kalinga,
2015, 2020
| Municipality | Household Population | Percent Change | |
| 2015 | 2020 | ||
| Balbalan | 5.3 | 5.1 | 3.77 |
| Lubuagan | 5.0 | 4.7 | -6.00 |
| Pasil | 5.4 | 5.1 | -5.56 |
| Pinukpuk | 5.1 | 4.7 | -7.84 |
| Rizal | 4.6 | 4.4 | -4.35 |
| City of Tabuk (Capital) | 4.9 | 4.7 | -4.08 |
| Tanudan | 6.1 | 5.6 | -8.20 |
| Tinglayan | 5.7 | 5.4 | 5.26 |
MARIBEL M. DALAYDAY
Chief Statistical Specialist
