

The Labor Force Survey (LFS) is a nationwide quarterly survey of households conducted by the Philippine Statistics Authority (PSA) to gather data on the demographic and socioeconomic characteristics of the population. The LFS provides a snapshot or the stock of economically active persons in the country at a particular point or reference period. It aims to monitor the changes in the employment status of persons in the working age population during a specified time period using the Labor Force Framework. The LFS concept and measurement follows the international standards concerning statistics of the economically active population, employment, unemployment and underemployment. These standards were adopted during the 13th International Conference of Labour Statisticians (ICLS) in October 1982 at Geneva, Switzerland.
CAR Labor Force Participation Rate (LFPR) is 62.7%
- The result of the 2017 Labor Force Survey showed that the Philippines’ labor force participation rate of persons whose age is 15 years old and over was estimated at 61.2 percent or about 42.8 million individuals. This means that six in every ten individuals aged 15 years old and over were either employed or unemployed.
Figure 1. Labor Force Participation Rate by Region, Philippines: 2017

- Cordillera Administrative Region (CAR) was among the regions with an LFPR higher than the national rate of 61.2 percent. However, the region’s LFPR decreased by 3.4 percentage points from 66.1 percent in 2016 to 62.7 percent in 2017
- Central Visayas posted the highest LFPR with 65.0 percent that translates to about 3.4 million individuals. The Autonomous Region of Muslim Mindanao (ARMM) had the lowest LFPR with 46.1 percent.
Employment rate in CAR is at 95.7%
- The number of employed persons in the region in 2017 was estimated at 745,000 individuals. This increased by 0.1 percentage point from 95.6 percent in 2016 to 95.7 percent in 2017.
Table 2. Percentage of Employed Persons in the Labor Force of CAR:
2016 and 2017
| Labor Force Participation Rate | Employment Rate | |||
|---|---|---|---|---|
| October 2016 (%) | October 2017 (%) | October 2016 (%) | October 2017 (%) | |
| Philippines | 63.6 | 62.1 | 95.3 | 95.0 |
| CAR | 65.8 | 64.2 | 95.5 | 96.3 |
Source: Philippine Statistics Authority
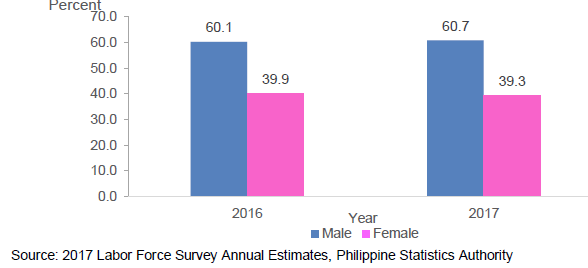
60.7 % of employed persons in CAR are males
- Of the estimated 745,000 employed persons in CAR in 2017, 60.7 percent or about 452,102 individuals were males, while 39.3 percent or about 292,567 individuals were females.
- Employed males in the region increased by 0.6 percentage point from 60.1 percent in 2016 to 60.7 percent in 2017. A corresponding decrease of 0.6 percentage point was recorded among the employed females from 39.9 percent to 39.3 percent in the same period.
Figure 1. Percentage Distribution of Employed Persons by Sex, CAR:
2016 and 2017
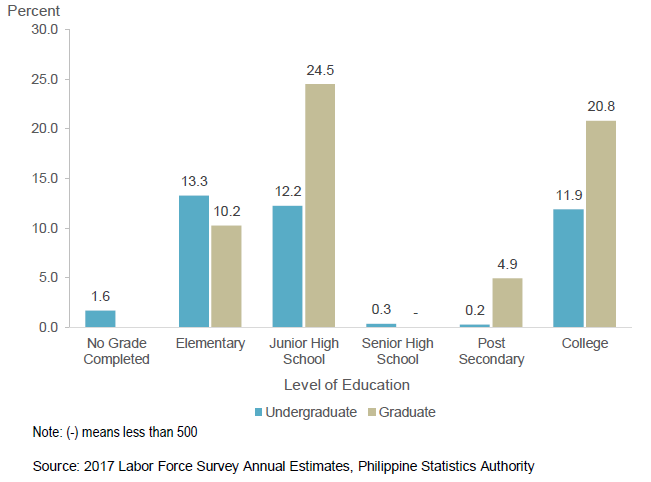
Most of the employed have high school education
- As to the highest grade completed of employed persons, those who had Junior High School education dominated the labor force with 36.7 percent, of which 24.5 percent or about 182,000 individuals graduated while 12.2 percent or about 91,000 individuals did not graduate.
- Employed persons with college education followed with 32.7 percent of the total employment in the region. Of these, 20.8 percent were graduates while 12.2 percent were undergraduates.
- Employed persons with elementary level education came third with a share of 23.5 percent, of which 10.2 percent graduated while 13.3 percent did not graduate.
- Employed persons with Post-Secondary level education accounted 5.1 percent of the total employed persons in the region. There were 4.9 percent employed persons who graduated, while 0.2 percent did not finish the course.
- The percentage of employed persons in CAR for 2017 with no education or grade level completed was at 1.6 percent. This level had the second lowest incidence of employment in the region next to those with Senior High School education.
Figure 2. Employed Persons by Highest Grade Completed, CAR: 2017
Service industry employs the most
- By industrial origin, Service industry employed the most with 43.8 percent share in 2017 followed by the Agriculture industry followed with 42.2 percent. Industry had the least share in the regional total employment in the same period with 14.0 percent.
- By sub-industry, Agriculture, Hunting and Forestry continued to be the biggest employer in the region with 42.0 percent share in 2017 or about 315,000 workers.
- Wholesale and retail trade, repair of motor vehicles and motorcycles ranked as the second largest sub-industry group with 12.6 percent of the total employed persons in 2017, followed by public administration, defense and compulsory social security with 8.6 percent.
- Manufacturing shared 3.3 percent to the total employment in the region in 2017.
Elementary occupations comprise 28%
- Among the occupation groups, elementary occupations comprised the largest group of employed persons in CAR with 28.1 percent of the total regional employment in 2017. This decreased by 2.9 percentage points from 31.0 percent in 2016.
- Skilled agricultural, forestry and fishery workers ranked the second largest occupation group with 24.6 percent of the total employed persons. This increased by 2.7 percentage points from the 21.9 percent in 2016.
- Managers made up the third largest occupational group in 2017 accounting for 12.1 percent in the total regional employment.
Table 3. Percentage of Employed Persons by Major Occupation Groups, CAR:
2016 and 2017
| Major Occupation Groups |
2016
|
2017 |
|---|---|---|
| Total of Employed Persons | 100.00 | 100.00 |
| 1. Elementary Occupations | 31.0 | 28.1 |
|
2. Skilled Agricultural, forestry and fishery workers
|
21.9 | 24.6 |
| 3. Managers | 12.9 | 12.1 |
| 4. Service and sales workers | 9.5 | 10.2 |
| 5. Professionals | 6.4 | 7.7 |
| 6. Craft and related trades workers |
4.0 |
4.8 |
|
7. Plant and machine operators and assemblers
|
5.2 | 4.8 |
| 8. Technicians and associate professionals | 2.8 | 3.2 |
| 9. Clerical support workers | 3.1 | 3.9 |
| 10. Armed Forces Occupations | 0.5 | 0.5 |
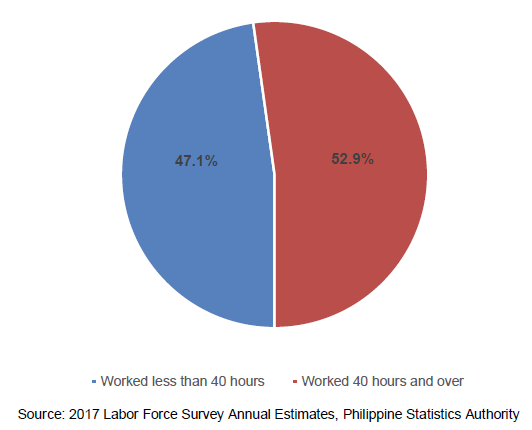
Cordillera’s underemployment decreases by 8.3 percentage points
- The underemployment rate in the region in 2017 was at 14.8 percent. This decreased by 8.3 percentage points from 23.1 percent in the previous year. The visible underemployment rate was estimated at 7.0 percent in 2017.
- The total underemployment in CAR was estimated at 110,000 individuals of which 52.9 percent of the underemployed persons were already working 40 hours per week and over.
- Meanwhile, those who work less than 40 hours a week accounted to 47.1 percent of the total underemployed persons in the region.
Figure 3. Distribution of Underemployed Persons by Working Hours in CAR: 2017
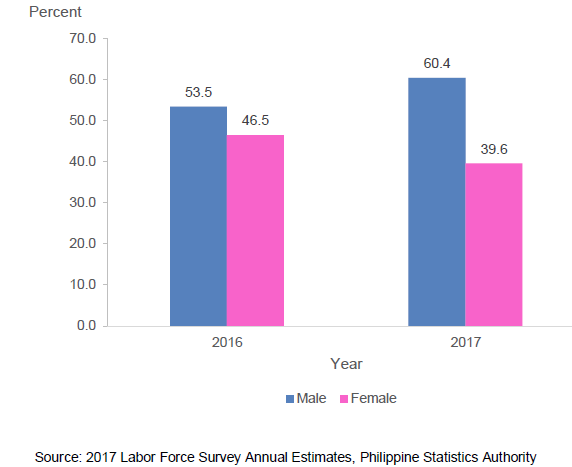
Unemployment at 4.3%
- Unemployment rate in the region decreased by 0.1 percentage point, from 4.4 percent in 2016 to 4.3 percent in 2017.
- Unemployed females decreased by 6.9 percentage points or to 39.6 percent in 2017 from 46.5 percent in 2016 to 39.6 percent in 2017. The observed decrease on the percentage of unemployed females correspond to the increase in the percentage of unemployed males
Figure 4. Distribution of Unemployed Persons by Gender, CAR: 2016 and 2017
Technical Notes
In the Labor Force or Economically Active Population -This refers to population 15 years old and over who are either employed or unemployed in accordance with the definitions described below.
Employed Persons - Persons who, during the reference period are 15 years and over as of their last birthday and are reported either:
a. At work -Those who do any work even for one hour during the reference period for pay or profit, or work without pay on the farm or business enterprise operated by a member of the same
household related by blood, marriage or adoption; or
b. With a job but not at work -Those who have a job or business but are not at work because of temporary illness/injury, vacation or other reasons. Likewise, persons who expect to report for
work or to start operation of a farm or business enterprise within two weeks from the date of the enumerator's visit are considered employed.
Underemployed Persons - Employed persons who express the desire to have additional hours of work in their present job or an additional job; or to have a new job with longer working hours. Visibly underemployed persons are those who work for less than 40 hours during the reference period and want additional hours of work.
Unemployed Persons -Persons who, during the reference period are 15 years old and over as of their last birthday who have no job/business and actively looking for work. Also considered as unemployed are persons without a job or business who are reported not looking for work because of their belief that no work was available or because of temporary illness/disability, bad weather, pending job application or waiting for job interview.
Persons Not in the Labor Force - Persons 15 years old and over who are neither employed nor unemployed according to the definitions mentioned. It refers to those persons who are not looking for work because of reasons such as housekeeping, schooling, etc. Examples are housewives, students, disabled or retired persons.
Work - Any economic activity that a person does for pay in cash or in kind, in any establishment, office, farm, private home or for profit or without pay on a family farm or enterprise. It also includes what a farm operator or member of the operator's family does on the farm operated by another household on exchange labor arrangement.
Work also refers to any activity that a person does in relation to minor activities in home gardening, raising of crops, fruits, hogs, poultry etc., fishing for home consumption and manufacturing for own use are also considered work. There must be some harvest in the case of home gardening, raising of crops, fruits and nuts and gathering of wild fruits and vegetables; animals disposed of (sold, consumed, bartered or given away) or some catch in fishing in order that these activities will be considered work.
Unpaid family workers or those who work without pay on own family-operated farm or business - These are members of the family who assist another member in the operation of the family farm or business enterprise, and who do not receive any wage or salary for their work. The room and board and any cash allowance given as incentives are not counted as compensation for these family workers.
Number of hours worked - This refers to the total number of hours a person actually worked in all the jobs/businesses that he held. It includes the duration or the period the person was occupied in his work, including overtime, but excluding hours paid but not worked. The normal working hours per day is the usual or prescribed working hours of a person in his primary job/business which is considered a full day's work.
