The economy of Cordillera grew by 4.3 percent in 2019 slower than the 5.7 percent growth during the previous year. The main driver for growth in CAR was the Services industry, specifically Financial and Insurance Activities (22.5 percent), Other Services (15.0 percent), and Public Administration and Defense; Compulsory Social Activities (11.8 percent).
Growth Rates by Industry/Sub-industry, Cordillera Administrative Region: 2018 -2019
At Constant 2018 Prices, in Percent
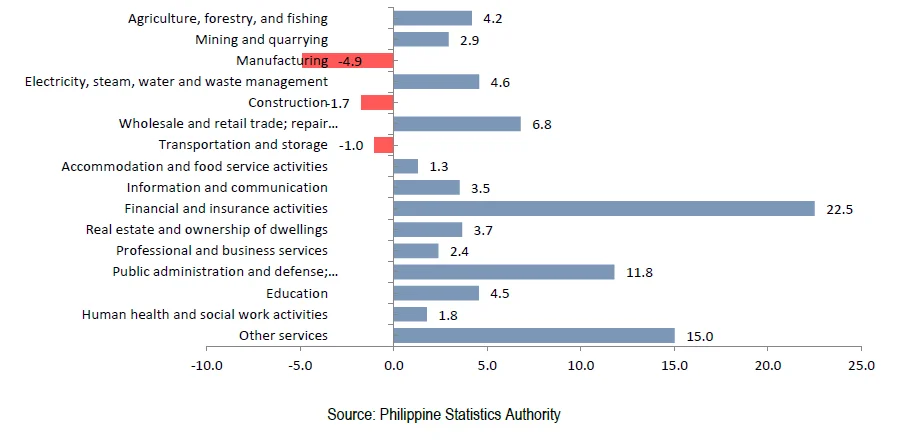
Industry that contributed 24.1 percent share to the regional economy declined by 2.5 percent in 2019 compared to the 7.7 percent growth in 2018. This was mainly attributed to the negative growths observed in Manufacturing (4.9 percent) and Construction (1.7 percent) sub-industries.
Agriculture, Forestry, and Fishing rebounded from a negative growth of 3.5 percent to positive growth of 4.2 percent in 2019.
Percent Share to the National Growth by Industry, Cordillera Administrative Region: 2019
At Constant 2018 Prices, in Percent
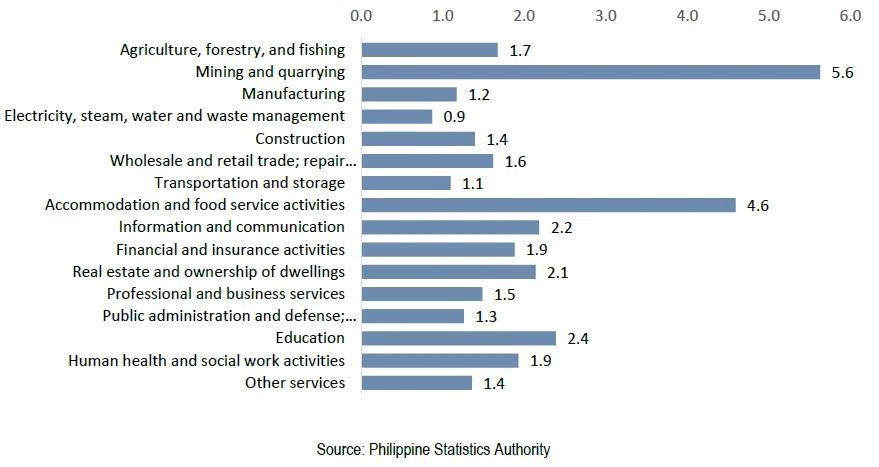
Of the 6.9 percent economic growth of the country in 2019, CAR was one of the regions who contributed least with 0.1 percent while accounting for only 1.7 percent of the total GDP. Mining and Quarrying (5.6 percent), Accommodation and Food Service Activities (4.6 percent), and Education (2.4 percent) were the top contributors of the region to the economic performance of the country.
Expenditure Performance of the Region
CAR among the least spenders in 2019
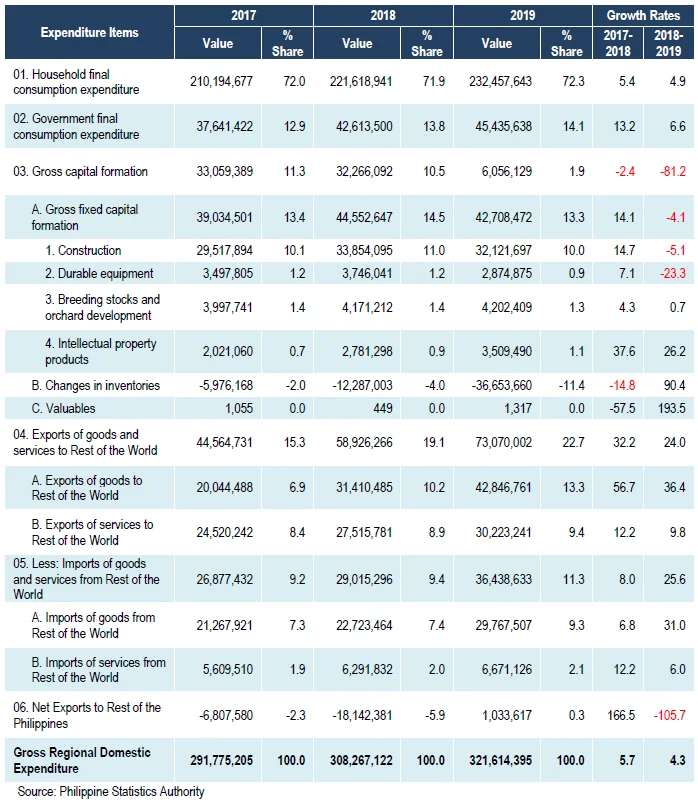
Cordillera remained to be one of the regions with the least domestic expenditures in 2019 with 1.7 percent share to the national Gross Domestic Expenditure (GDE). The spending of the region increased by 4.3 percent, slower than the 5.7 percent growth in 2018. Imports of Goods and Services from the Rest of the World (25.6 percent), Exports of Goods and Services to the Rest of the World (24.0 percent), and Government Final Consumption Expenditure (6.6 percent) were the main contributors to the growth of GRDE of the region in 2019.
Growth Rate by Expenditure Type, Cordillera Administrative Region: 2018-2019
At Constant 2018 Prices, in Percent
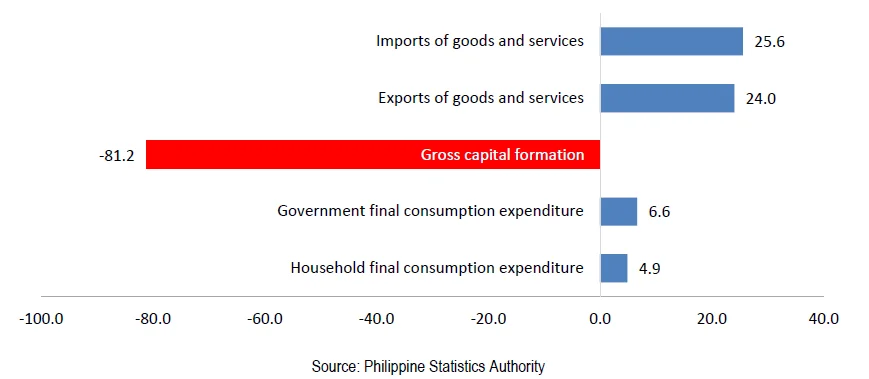
Valuables, under Gross Capital Formation, grew more than fourfold from negative growth rate of 57.5 percent in 2018 to positive 193.5 percent in 2019. On the other hand, expenditure in Durable Equipment, under Gross Fixed Capital Formation, experienced the biggest decline from 7.1 percent growth in 2018 to negative 23.3 percent in 2019.
In terms of contribution to growth by expenditure type in 2019, Exports of Goods and Services to the Rest of the World accounted for the largest contribution to regional growth with 4.6 percent whereas the least contributor was Gross Capital Formation with negative 8.5 percent.
Per Capita Household Final Consumption Expenditure, Philippines and Cordillera Administrative Region: 2019
At Constant 2018 Prices, in Pesos
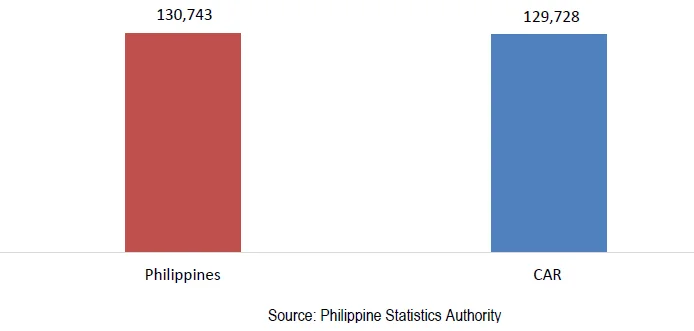
The per capita Household Final Consumption Expenditure (HFCE) of CAR was estimated at 129,720 pesos in 2019. This means that, on the average, an individual member of a household spent 129,720 pesos on final consumption of goods and services that includes purchase of consumer goods and services, barter transactions, goods and services in kind, and goods and services produced and consumed by the same individual. This increased from the previous year’s per capita HFCE of 124,841 pesos. The per capita HFCE of CAR in 2019 was slightly lower than the national per capita HFCE of 130,743 pesos.
CAR was also among the eight regions that surpassed the 100,000 peso-mark in terms of per capita HFCE in 2019.
Table 1. Value (In Thousand Philippine Peso), Percentage Share and Growth Rates of Gross Regional Domestic Product (GRDP),
by Industry, Cordillera Administrative Region (CAR): 2017-2019
by Industry, Cordillera Administrative Region (CAR): 2017-2019
At Constant 2018 Prices
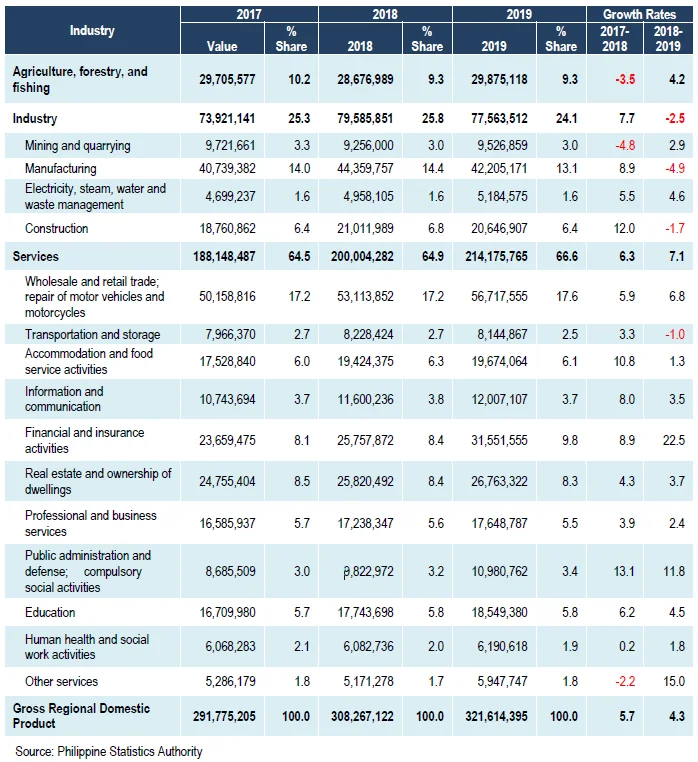
Table 2. Value (In Thousand Philippine Peso), Percentage Share and Growth Rates of Gross Regional Domestic Expenditure (GRDE),
by Industry, Cordillera Administrative Region (CAR): 2017-2019
At Constant 2018 Prices