

The Philippine Statistics Authority (PSA) generates statistics for freshwater municipal aquaculture and municipal inland fishing. The Quarterly Inland Municipal and Quarterly Aquaculture Surveys are conducted in sample aquaculture farms and sample inland fishing households. The respondents of the surveys are aquafarm operators, fishermen or other knowledgeable members of the household. Generated quarterly fisheries production is included in the quarterly data review process of the PSA at the provincial, regional and national levels. After the data validation, preliminary estimates are made available to data users.
Table 1. Fishery Production by Aquafarm Type in CAR by Province: CY 2019
| Region/Province | Production (MT) | % Change | |
| CY 2018 | CY 2019 | ||
| CAR | 4,418.8 | 4,157.6 | (5.9) |
| Inland | 1,111.2 | 1,092.9 | (1.6) |
| Aquaculture | 3,307.6 | 3,064.7 | (7.3) |
| Abra | 619.7 | 603.0 | (2.7) |
| Inland | 260.7 | 251.5 | (3.5) |
| Aquaculture | 359.0 | 351.5 | (2.1) |
| Apayao | 314.0 | 323.7 | 3.1 |
| Inland | 214.4 | 234.9 | 9.6 |
| Aquaculture | 99.7 | 88.9 | (10.8) |
| Benguet | 409.1 | 352.4 | (13.9) |
| Inland | 105.1 | 71.3 | (32.2) |
| Aquaculture | 304.0 | 281.1 | 7.5 |
| Ifugao | 2,657.5 | 2,377.0 | (10.6) |
| Inland | 240.5 | 199.5 | (17.0) |
| Aquaculture | 2,417.0 | 2,177.5 | (9.9) |
| Kalinga | 404.6 | 486.1 | 20.1 |
| Inland | 286.8 | 331.4 | 15.5 |
| Aquaculture | 117.9 | 154.7 | 31.3 |
| Mountain Province | 13.9 | 15.4 | 11.0 |
| Inland | 3.9 | 4.4 | 13.5 |
| Aquaculture | 10.0 | 11.0 | 10.0 |
- The total fishery production of the Cordillera Administrative Region (CAR) decreased by 5.9% from 4,418.8 metric tons (MT) in 2018 to 4,157.6 MT in 2019 contributed by both freshwater Municipal Inland and Aquaculture that declined by 1.6% and 7.3%, respectively (Table 1).
Table 2. Distribution of Total Fishery Production by Aquafarm Type in CAR
by Province: CY 2019
| Region/Province | Production (MT) | % to Total |
| CAR | 4,157.6 | 100.0 |
| Inland | 1,092.9 | 26.3 |
| Aquaculture | 3,064.7 | 73.7 |
| Abra | 603.0 | 14.5 |
| Inland | 251.5 | 6.0 |
| Aquaculture | 351.5 | 8.5 |
| Apayao | 323.7 | 7.8 |
| Inland | 234.9 | 5.6 |
| Aquaculture | 88.9 | 2.1 |
| Benguet | 352.4 | 8.5 |
| Inland | 71.3 | 1.7 |
| Aquaculture | 281.1 | 6.8 |
| Ifugao | 2,377.0 | 57.2 |
| Inland | 199.5 | 4.8 |
| Aquaculture | 2,177.5 | 52.4 |
| Kalinga | 486.1 | 11.7 |
| Inland | 331.4 | 8.0 |
| Aquaculture | 154.7 | 3.7 |
| Mountain Province | 15.4 | 0.4 |
| Inland | 4.4 | 0.1 |
| Aquaculture | 11.0 | 0.3 |
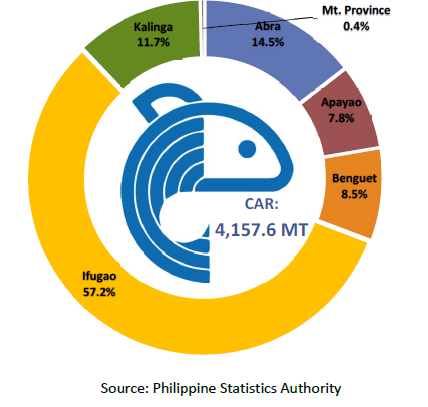
- Out of the total regional fishery production of 4,157.6 MT, aquaculture contributed 3,064.7 MT (73.7%) and fishery production contributed 1,092.9 MT (26.3%).
- In 2019, Ifugao was consistently the top producer with 2,377.0 MT accounting 57.2% of the total regional fishery production. Abra province distantly came second with 14.5% share, followed by Kalinga with 11.7%, Benguet with 8.5%, and Apayao with 7.8% (Figure 1).
- Mountain Province contributed the smallest share in the fishery of the region with an output of 15.4 MT comprising only 0.4% of the total fish production in the region (Table 2).
Figure 1. Percentage Distribution of Total Fisheries Production in CAR
by Province: CY 2019
MUNICIPAL INLAND PRODUCTION
- Inland municipal fishing refers to fishing in inland waters like lakes, rivers, and dams. Using simple gears and fishing boats some of which are non-motorized with a capacity of less than three (3) gross tons, or fishing not requiring the use of fishing boats.
- Cordillera municipal inland fishing output during the CY 2019 was 1,092.9 MT, comprising 26.3% of the total fish production in the region (Table 3).
Table 3. Municipal Inland Production in CAR by Province, CY 2019
| Region/Province | Production (MT) | % |
| CAR | 1,092.9 | 100.0 |
| Abra | 251.5 | 23.0 |
| Apayao | 234.9 | 21.5 |
| Benguet | 71.3 | 6.5 |
| Ifugao | 199.5 | 18.3 |
| Kalinga | 331.4 | 30.3 |
| Mountain Province | 4.4 | 0.4 |
Figure 2. Percentage Distribution of Municipal Inland Production in CAR,
by Province: CY 2019
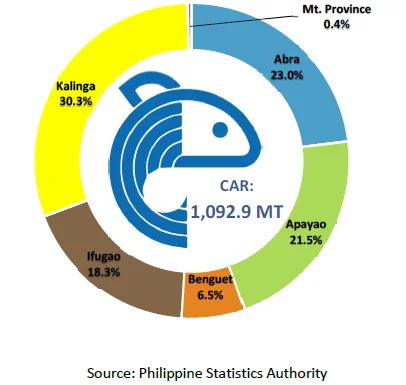
- Kalinga was the top inland fishing province with 331.4 MT, comprising 30.3% of the total inland fishery production of the region. Abra came second with 23.0% share followed by Apayao with 21.5% share. Ifugao came fourth with 18.3% share. The provinces with the smallest shares were Benguet and Mountain Province with 6.5% and 0.4% shares, respectively (Figure 2).
AQUACULTURE PRODUCTION
- Aquaculture is a fishery operation involving all forms of raising and culturing of fish and other fishery species in fresh, brackish and marine water areas.
Table 4. Aquaculture Production and Area Harvested in CAR, by
Province: CY 2019
| Region/Province | Production (MT) | Area Harvested (Has) |
| CAR | 3,064.7 | 551.0 |
| Abra | 351.5 | 148.7 |
| Apayao | 88.9 | 62.1 |
| Benguet | 281.1 | 33.9 |
| Ifugao | 2,177.5 | 259.0 |
| Kalinga | 154.7 | 43.2 |
| Mountain Province | 11.0 | 4.0 |
- In 2019, CAR registered an aquaculture production of 3,064.7 MT with an estimated area harvested of 551.0 hectares. Aquaculture dominated the region’s total fisheries accounting for 73.7% of the total fish production (Table 4).
Figure 3. Percentage Distribution of Aquaculture Production in CAR
by Province: CY2019
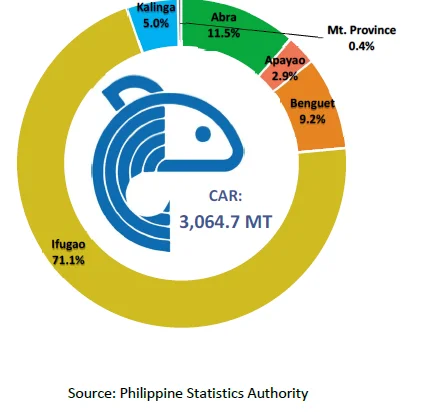
- Ifugao province posted the highest production with 2,177.5 MT from an area harvested of 259.0 hectares. Abra was a distant second with 351.5 MT with an area harvested of 148.7 hectares while Mountain Province had the least production in the region with only 11.0 MT and an area harvested of 4.0 hectares (Table 4).
-
In terms of percentage distribution in aquaculture production in the region, Ifugao contributed 71.1%. Abra came second with 11.5% share. The other provinces and their share to total aquaculture production were Benguet with 9.2%; Kalinga with 5.0%; and Apayao with 2.9%. Mountain Province had the smallest share with 0.4% (Figure 4).
