

CAR is 43% forestland
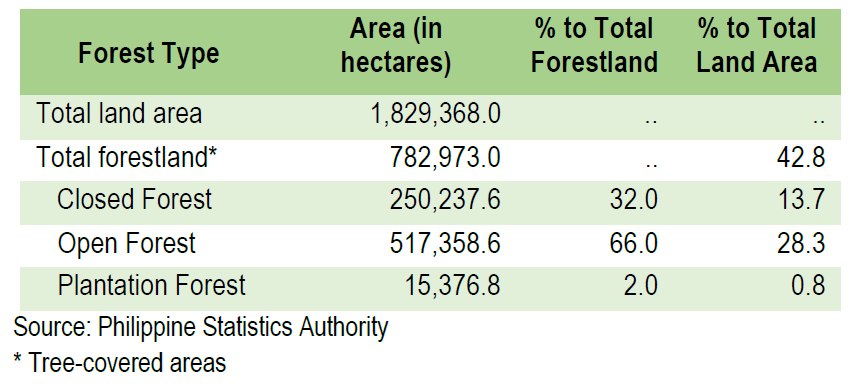
- The stock of timber resources was derived from the forest cover of the region. Table 1 presents the 2010 Land Cover of CAR which served as baseline data in the accounting process. Forestlands cover a total of 782,973 hectares or 42.8 percent of the region’s total land area, 28.3 percent of which is open forest, 13.7 percent is closed forest and 0.8 percent is plantation forest.
Table 1. Land Area by Forest Type, CAR: 2010
- Forests, like timber, are vital natural resources. They are the main source of oxygen and take in carbon dioxide from the atmosphere. They produce goods, timber and non-timber products and provide ecosystem services that are crucial for human. They serve as the main watershed of rivers, streams and creeks preserving adequate water supply, and habitat of diverse flora and fauna which are important genetic sources of medicine, food and other products of economic use.
Stock of standing timber is 139 million cubic meters within an area of 870 thousand hectares in 2015
- The estimates of stock of timber resources in terms of area increased from 751,836 hectares in 1999 to 869,856 hectares by the end of 2015. The area increased by 15.7 percent from 1999 to 2015 representing an annual average increase of 0.9 percent or 6,942 hectares per year.
Table 2. Stock of Timber Resources, CAR: 1999-2015
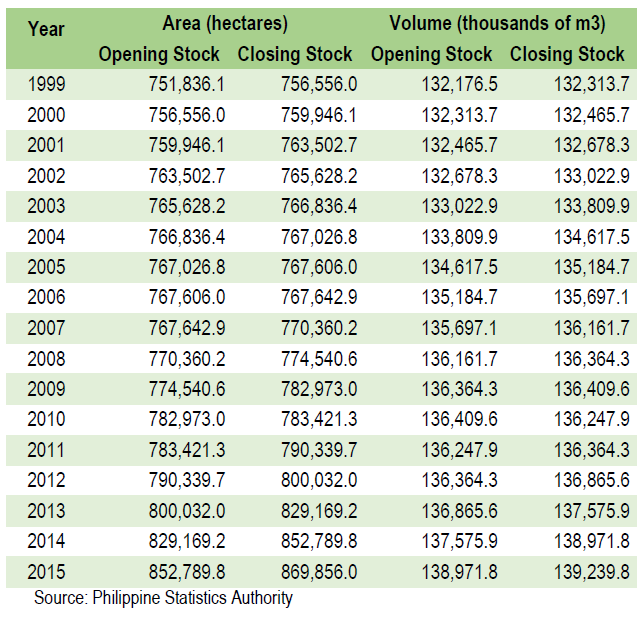
- The stock of timber resources of CAR in terms of volume of standing timber increased from 132,313,738 cubic meters in 1999 to 139,239,777 cubic meters in 2015. The volume increased by 5.2 percent from 1999 to 2015 representing an annual average growth rate of 0.3 percent or 432,878 cubic meters per year.
- The volume of stock in afforested/reforested area can only be accounted as timber resources five years after the date of planting or the age of maturity of a tree.
- The volume of stock of timber in CAR increased owing to the reforestation efforts of government agencies and the private sector. On the other hand, the decrease in stock was due to timber production and area affected by forest disturbances.
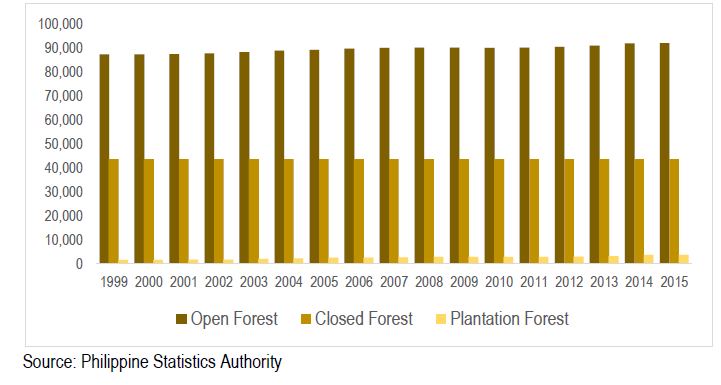
Open forest comprises 566 thousand hectares in 2015
- The area of open forest posted an increasing trend. It increased by an average of 0.8 percent from an opening stock of 495,563 hectares in 1999 to 566,230 hectares opening stock in 2015 or an additional 4,417 hectares annually.
- The area of plantation forest in the region significantly increased from 6,036 hectares opening stock in 1999 to 36,322 hectares opening stock in 2015 representing an annual average growth of 11.9 percent or 1,893 hectares per year.
Figure 1. Opening Stock per Forest Type, CAR: 1999-2015
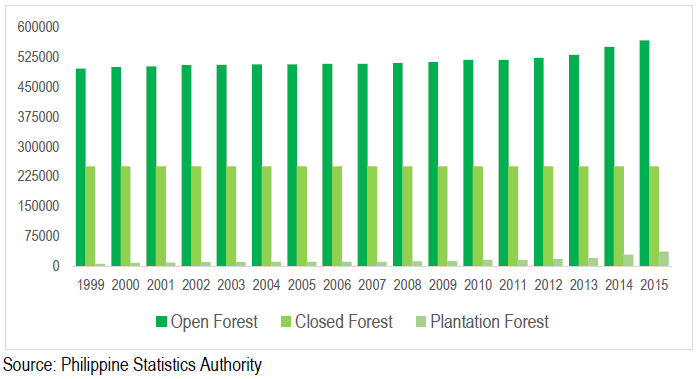
- It can be observed in Figure 1 that the area of closed forests did not change throughout the accounting period. This is because these areas are legally closed to any form of intensive human activities and occupation and so valuation is equal to zero.
Area reforested is 3 thousand hectares yearly from 1999 to 2010 and 18 thousand hectares from 2011 to 2015
- The annual average area afforested/reforested by various sectors from 1999 to 2010 was about 3,008 hectares. With the implementation of the National Greening Program via Executive Order No. 11 series of 2011, the area effectively afforested/reforested increased to an annual average of 17,595 hectares during the period 2011 to 2015.
- As presented in Figure 2, the largest increase to the stock of timber resources was incurred in 2013 with 29,137 hectares of area afforested/reforested while the smallest increase occurred in 2006 with 37 hectares.
- On the other hand, a total of 953 hectares were affected by timber production and 5,100 hectares were affected by forest disturbances. All in all, only about 6,053 hectares were estimated for the reductions in stock during the 17-year period.
Figure 2. Area Afforested/Reforested Versus Area Affected by Forest Disturbance, CAR: 1999-2015
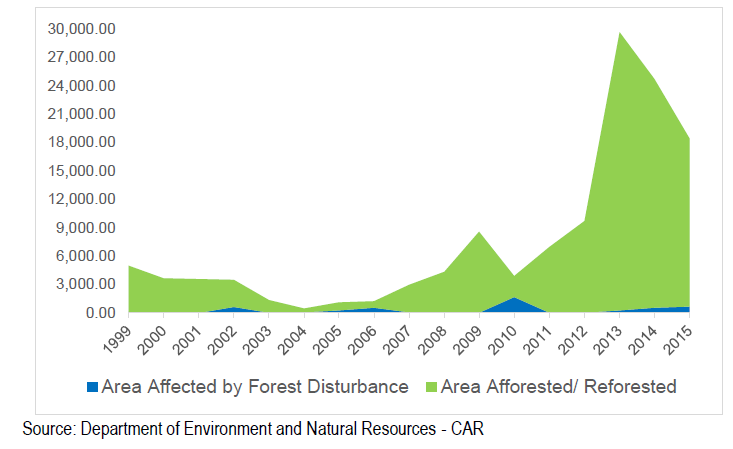
- The widest area affected by forest destruction was recorded in 2010 with a total of 1,679 hectares on which 96.2 percent or 1,616 hectares were damaged by forest fires.
Almost a third of timber resources are in closed forests
- The closing stock of timber resources in 2015 in terms of volume was estimated at 139.2 million cubic meters of which 31.3 percent or 43.6 million cubic meters were in closed forests.
Figure 3. Closing Volume of Timber Resources in Open, Closed and Plantation Forest, CAR: 1999-2015 (in Thousands of Cubic Meters over Bark)
- Changes in the stock of timber resources in terms of volume were positive throughout the accounting period except for 2010 when a decrease of 161,610 cubic meters was recorded due to forest destruction. The largest increase was observed in 2014 with 1.4 million cubic meters.
- The volume for open forest and plantation forest gradually increased during the accounting period from 87.3 million cubic meters and 1.4 million cubic meters in 1999 to 92.1 million cubic meters and 3.5 million cubic meters in 2015 respectively. The minimal volume reduction in open forests and plantation forests was due to the implementation of the logging moratorium.
Timber resources are valued at 407 billion pesos in 2015
- At current prices, the total value of timber resources in the region increased from ₱203.7 billion in 1999 to ₱406.6 billion in 2015. This represented an annual average growth of 4.4 percent or increments of ₱12.7 billion annually (Table 3).
Table 3. Summary of Monetary Asset Account for Timber Resources, at Current Price, CAR: 1999-2015 (in ‘000 Pesos)
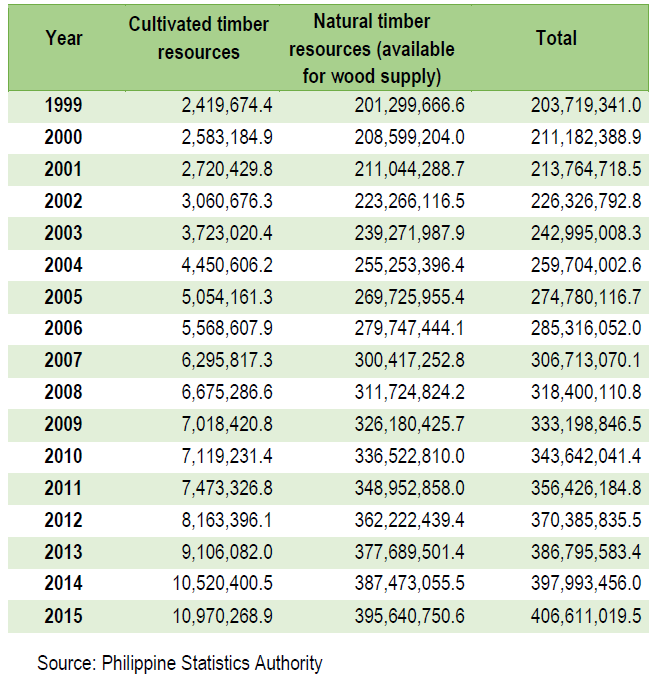
Table 4. Summary of Monetary Asset Account for Timber Resources, at Constant Price, CAR: 1999-2015 (in ‘000 Pesos)
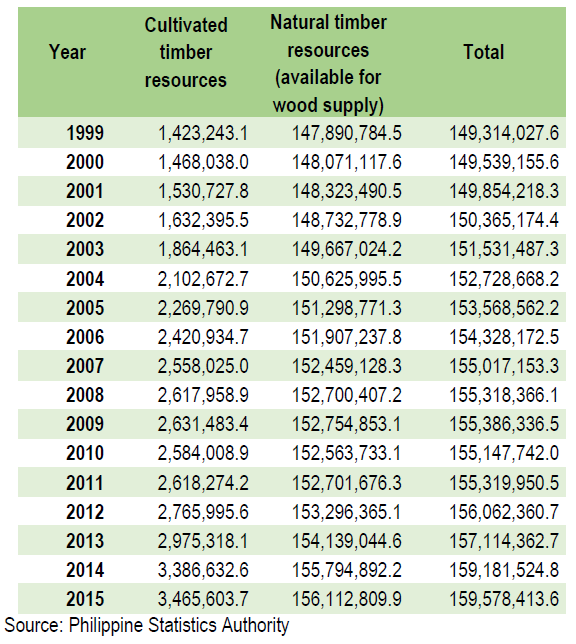
- At constant prices, the monetary valuation of timber resources revealed a slight decrease in 2010 because of negative net changes (Table 4). The value of timber resources in the region from ₱149.3 billion in 1999 to ₱159.6 billion in 2015 represented an average growth of 0.4 percent or increments of ₱641.5 million yearly.
Timber resources in protected areas are valued at 238 billion pesos in 2015
- Natural timber resources, not available for wood supply were not included in the asset accounts for timber resources in monetary terms. Protected forests and where logging is prohibited, the value of the standing timber in terms of income from the sale of timber resources is reduced to zero. Protected forests are all considered inside the closed forests according to the Department of Environment and Natural Resources (DENR).
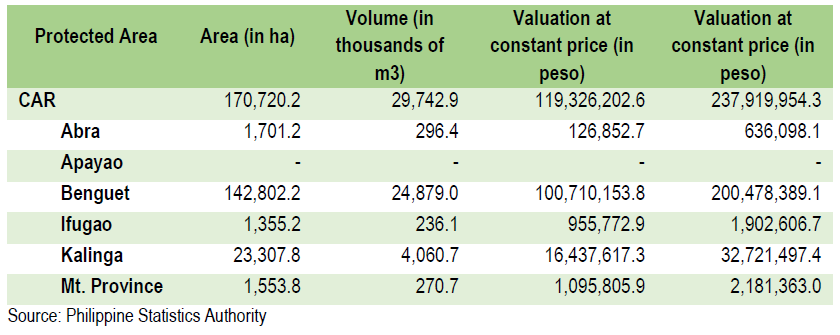
- Area of closed forest was estimated at 250,237.6 hectares and protected areas at 170,720.2 hectares. Protected areas comprised about 68.2 percent of closed forests.
- If we valuate the standing timber in the protected areas of CAR, it was estimated to be at ₱119.3 billion and ₱237.9 billion at constant and current prices respectively
Table 5. Valuation of Timber in Protected Areas, CAR as of 2015 (in ‘000 Pesos)
- At yearend of 2015, the combined value of timber available for wood supply and that of timber in protected areas would amount to a total of ₱278.9 billion at constant prices and ₱644.5 billion in current prices.
Technical Notes
Closed forest – formations where trees in the various storeys and the undergrowth cover a high proportion (>40 percent) of the ground and do not have a continuous dense grass layer. They are either managed or unmanaged forest, in advance state of succession and may have been logged over one or more times, having kept their characteristics of forest stands, possibly with modified structure and composition (FAO, 2000).
Fallow – refers to woody vegetation resulting from the clearing of natural forest for shifting agriculture. It is an intermediate class between forest and non-forest land uses. Part of the area, which is not under cultivation, may have the appearance of a forest.
Open forest – formations with discontinuous tree layer with coverage of at least 10 percent and less than 40 percent. They are either managed or unmanaged forests, in initial state of succession (FAO, 2000).
Plantation forest – forest stands established by planting or/and seeding in the process of afforestation or reforestation (FAO, 2000).
Shrubland – where the dominant woody vegetation are shrubs, generally of more than 0.5 meter and less than 5 meters in height in maturity and without a definite crown. The growth habit can be erect, spreading or prostate. The height limits for trees and shrubs should be interpreted with flexibility, particularly the minimum tree and maximum shrub height, which may vary between 5 and 7 meters approximately.
System of Environmental-Economic Accounting 2012 – Central Framework is an international statistical standard for environmental-economic accounting. It is a multipurpose conceptual framework for understanding the interaction between the economy and the environment.
Wooded grassland – areas predominantly vegetated with grasses such as Imperata, Themeda, Saccharum and where the tree cover is between 5 to 10 percent of area and their height may reach 5 meters at maturity.
