

Production
- In 2018, the Philippines produced 19,066,094 metric tons (MT) of palay, harvested from a total area of 4,800,406 hectares (Ha). The production decreased by 1.1 percent (210,253 MT) compared to the 19,276,347 MT produced in 2017.
Table 1. Palay Production by Region, Philippines: CY 2018
| Region | Production (MT) | % Share to National |
|---|---|---|
| Philippines | 19,066,094 | 100.0 |
| CAR | 391,105 | 2.1 |
| Ilocos Region | 1,720,044 | 9.0 |
| Cagayan Valley | 2,379,771 | 12.5 |
| Central Luzon | 3,615,115 | 19.0 |
| CALBARZON | 420,233 | 2.2 |
| MIMAROPA | 1,230,988 | 6.5 |
| Bicol Region | 1,350,438 | 7.1 |
| Western Visayas | 2,232,293 | 11.7 |
| Central Visayas | 309,459 | 1.6 |
| Eastern Visayas | 946,877 | 5.0 |
| Zamboanga Peninsula | 728,673 | 3.8 |
| Northern Mindanao | 761,400 | 4.0 |
| Davao Region | 488, 105 | 2.6 |
| SOCCSKSARGEN | 1,343,125 | 7.0 |
| CARAGA | 510,071 | 2.7 |
| ARMM | 638,397 | 3.3 |
- Central Luzon remained the top producer of palay among the regions, contributing the biggest share with 19.0 percent, followed by Cagayan Valley with 12.5 percent, and Western Visayas with 11.7 percent. On the other hand, Central Visayas produced the least with 1.6 percent, followed by the Cordillera Administrative Region (CAR) with 2.1 percent, and CALABARZON with 2.2 percent.
-
CAR ranked 15th with 2.1 percent or equivalent to 391,105 MT share in the nationalpalay production, harvested from a total area of 115,555 hectares.
Table 2. Palay Harvested by Ecosystem,
CAR: CY 2017-2018 (in metric tons)
| Item | 2017 | 2018 | % share to total area (2018) | %change (2017-2018) |
|---|---|---|---|---|
| Total Harvest area | 445,006 | 391,105 | 100.0 | (12.1) |
| Irrigated | 389,558 | 349,285 | 89.3 | (10.3) |
| Rainfed | 42,785 | 34,380 | 8.8 | (19.6) |
| Upland | 12,663 | 7,440 | 1.9 | (41.2) |
- Total palay harvested in CAR in 2018 decreased by 12.1 percent from the previous harvest of 445,006 MT.
- All types of palay ecosystem decreased. Irrigated palay decreased by 10.3 percent (55,064 MT), rainfed palay by 19.6 percent (4,154 MT), and upland palay by 41.2 percent (2,940 MT).
- As to production by ecosystem, irrigated palay had the highest production with 89.3 percent, followed by rainfed palay with 8.8 percent, and upland palay with 1.9 percent.
Figure 1. Percentage Distribution of Palay Production
by Province, CAR: CY 2018
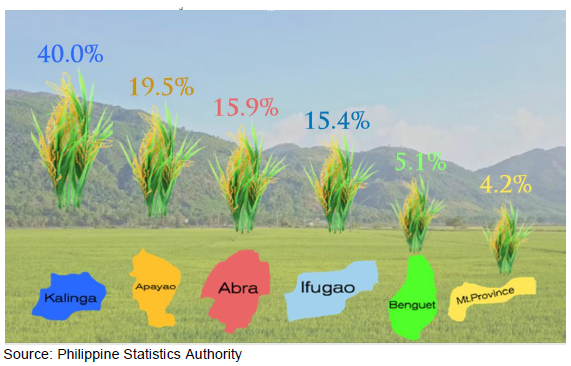
- Among provinces, Kalinga produced the highest at 40.0 percent (156,269 MT), followed by Apayao at 19.5 percent (76,346 MT). Abra and Ifugao almost had the same share at 15.9 percent (62,120 MT) and 15.4 percent (60,077 MT), respectively. On the other hand, Mountain Province produced the least with 4.2 percent (16,376 MT).
Harvested Area
- In 2018, a total of 111,387 Ha of harvested area was recorded in CAR. This decreased by 3.6 percent (4,168 Ha) from 115,555 Ha in 2017. The same trend was observed for all types of palay ecosystem.
Table 3. Palay Harvested Area by Ecosystem,
CAR: CY 2017-2018 (in hectares)
| Item | 2017 | 2018 | % share to total area (2018) | %change (2017-2018) |
|---|---|---|---|---|
| Total Harvest area | 115,555 | 111,387 | 100 | (3.61) |
| Irrigated | 92,205 | 90,420 | 81.2 | (1.94) |
| Rainfed | 15,972 | 15,256 | 13.7 | (4.48) |
| Upland | 7,378 | 5,711 | 5.1 | (22.59) |
- Irrigated areas accounted for 81.2 percent of the total area harvested, followed by the rainfed areas at 13.7 percent, and upland areas at 5.1 percent.
Figure 2. Map Distribution of Palay Harvested Area
by Province, CAR: CY 2018
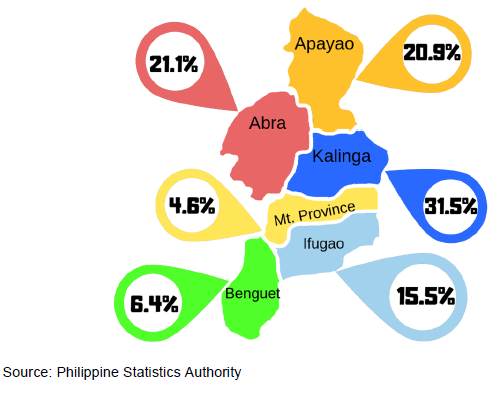
- Among provinces, Kalinga had the largest harvested area with 31.5 percent (35,062 Ha), followed by Abra with 21.1 percent (23,541 Ha), and Apayao with 20.9 percent (23, 312 Ha). Meanwhile, Mountain Province had the smallest harvested area with 4.6 percent (5,159 Ha).
Yield
- The average yield of palay in CAR was 3.51 MT/Ha in 2018, decreasing by 8.8 percent from 3.85 in 2017
Table 4. Palay Yield (MT/Ha) by Ecosystem, CAR: CY 2017-2018
| Item | 2017 | 2018 | % change, 2017 vs. 2018 |
|---|---|---|---|
| Average Yield (MT/Ha) | 3.85 | 3.51 | (8.8) |
| Irrigated | 4.22 | 3.86 | (8.5) |
| Rainfed | 2.68 | 2.25 | (16.0) |
| Upland | 1.72 | 1.30 | (24.4) |
- Among ecosystem, irrigated palay posted the highest yield with 3.86 MT/Ha while upland palay yielded the lowest with 1.30 MT/Ha.
Figure 3. Palay Yield (MT/Ha) by Province, CAR: CY 2018
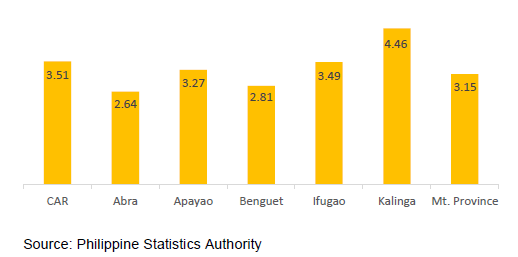
- By province, Kalinga posted the highest yield among the CAR provinces with 4.46 MT/Ha, followed by Ifugao with 3.49 MT/Ha, and Apayao with 3.27 MT/Ha. On the other hand, Abra had the lowest yield with 2.64 MT/Ha.
Technical Notes
Irrigated - area with irrigation facilities supplying water through artificial means like gravity, force/power, pump, etc. Irrigated area become rainfed only, when the irrigation system is no longer operational for the past two (2) years and beyond repair and there is no plan of irrigating the farm.
Rainfed – area which holds standing water but solely dependent on rainfall for its water supply. It may have dikes that retain rainwater.
Upland - farm land which has no amenities to hold for standing water. It is usually located along elevated lands, along rivers, between hills, hillsides, etc. Though crops planted in this type of ecosystem are drought-resistant and do not require standing water for their normal growth, irrigation by flushing is sometimes practiced to improve the crops’ performance especially during the long dry spell.
Yield - is an indicator of productivity derived by dividing total production by the area harvested.
Production - quantity produced and actually harvested during the reference period, includes those harvested but damaged, stolen, given away, consumed, given as harvester’s share, reserved etc.
Area harvested - actual area from which harvests are realized.
