

- In 2017, the country’s total production for broccoli, cabbage, carrots, habitchuelas, Chinese pechay, and white potato registered a combined output of 373,843.8 metric tons, slightly lower by 0.25 percent compared to the production in 2016 with 372,906.7 metric tons.
Table 1. Broccoli Production by Region, Philippines: 2013-2017
| Region | Volume (MT) | ||||
|---|---|---|---|---|---|
| CY 2013 | CY 2014 | CY 2015 | CY 2016 | CY 2017 | |
| PHILIPPINES | 3,026.4 | 3,064.3 | 2,911.1 | 2,859.0 | 3,159.1 |
| CAR | 1,948.4 | 1,984.1 | 1,890.1 | 1,820.6 | 2,077.0 |
| Ilocos Region | - | - | - | - | - |
| Cagayan Valley | 17.2 | 16.1 | 161.1 | 16.7 | 22.2 |
| Central luzon | - | - | - | - | - |
| Calabarzon | 1.2 | 6.8 | 0.5 | 0.2 | - |
| Mimaropa | - | - | - | - | - |
| Bicol Region | - | - | - | - | - |
| Western Visayas | 7.5 | 6.8 | 11.5 | 10.4 | 9.2 |
| Central Visayas | 222.0 | 167.1 | 169.3 | - | 151.0 |
| Eastern Visiayas | - | - | - | - | - |
| Zamboanga Peninsula | - | - | - | - | - |
| Northern Mindanao | 820.6 | 872.0 | 812.0 | 827.5 | 876.7 |
| Davao Region | 8.1 | 9.7 | 9.7 | 12.5 | 18.2 |
| Soccsksargen | 1.6 | 1.8 | 1.9 | 2.5 | 4.3 |
| Caraga | - | - | - | - | - |
| ARMM | - | - | - | - | - |
- Broccoli production went up by 10.5 percent nationwide in 2017. Cordillera contributed the biggest increase in production followed by Northern Mindanao, Central Visayas, Cagayan Valley and Davao Region (Table 1).
Figure 1. Brocoli Production (%) by Region, Philippines: 2017
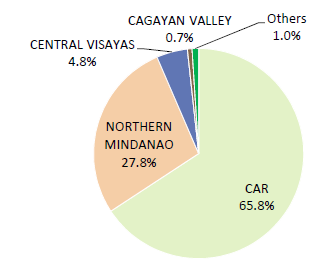
- Cordillera region was the consistent top producer of broccoli in the country. In 2017 it comprised 65.8 percent of the country’s total production in followed by Northern Mindanao with 27.8 percent, Central Visayas with 4.8 percent and Cagayan Valley with 0.7 percent while other regions contributed 1.0 percent (Figure 1).
Table 2. Cabbage Production by Region, Philippines: 2013-2017
| Region | Volume (MT) | ||||
|---|---|---|---|---|---|
| CY 2013 | CY 2014 | CY 2015 | CY 2016 | CY 2017 | |
| PHILIPPINES | 127,463.5 | 127,986.5 | 125,752.4 | 123,080.0 | 122,474.1 |
| CAR | 99,957.6 | 99,520.1 | 97,306.8 | 94,727.8 | 94,233.1 |
| Ilocos Region | 3,159.7 | 3,215.1 | 3,257.1 | 3,265.2 | 3,300.3 |
| Cagayan Valley | 1,183.8 | 1,188.7 | 1,537.2 | 1,611.7 | 1,655.2 |
| Central luzon | - | - | - | - | - |
| CALABARZON | 797.4 | 828.3 | 760.5 | 696.0 | 615.9 |
| MIMAROPA | 28.6 | 29.7 | 32.6 | 32.9 | 33.0 |
| Bicol Region | 239.1 | 186.8 | 112.4 | 113.6 | 111.9 |
| Western Visayas | 451.3 | 440.7 | 484.0 | 319.4 | 487.0 |
| Central Visayas | 8,518.6 | 8,687.9 | 8,500.2 | 6,160.8 | 8,340.5 |
| Eastern Visiayas | 149.7 | 132.8 | 138.1 | 136.9 | 116.5 |
| Zamboanga Peninsula | 534.3 | 773.0 | 792.7 | 821.1 | 789.8 |
| Northern Mindanao | 6,296.8 | 6,709.7 | 6,672.4 | 6, 523.7 | 6,806.6 |
| Davao Region | 4, 44.2 | 4,246.7 | 4,465.9 | 4,210.2 | 4,253.1 |
| Soccsksargen | 1,513.9 | 1,563.7 | 1,430.4 | 1,384.9 | 1,292.4 |
| CARAGA | 11.2 | 3.8 | 3.0 | 2.8 | 3.1 |
| ARMM | 459.5 | 459.7 | 459.2 | 461.8 | 425.7 |
- The country’s cabbage production slightly declined by 0.5 percent in 2017. Cordillera region recorded the biggest decline in production followed by SOCCSKSARGEN, CALABARZON and Eastern Visayas (Table2).
Figure 2. Cabbage Production (%) by Region, Philippines: 2017
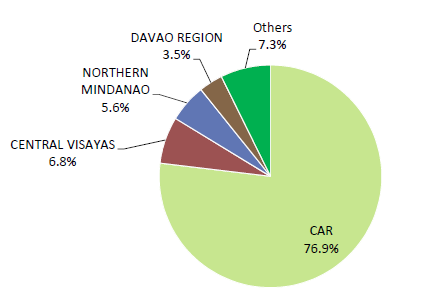
- Cordillera region remained the major producer of cabbage in the country contributing 76.9 percent to the national output. Central Visayas, Northern Mindanao and Davao Region shared a combined output of 15.9 percent while the rest of the regions contributed 7.3 percent (Figure 2).
Table 3. Carrots Production by Region, Philippines: 2013-2017
| Region | Volume (MT) | ||||
|---|---|---|---|---|---|
| CY 2013 | CY 2014 | CY 2015 | CY 2016 | CY 2017 | |
| PHILIPPINES | 68,110.8 | 68,342.1 | 67,037.0 | 65,986.5 | 65,219.4 |
| CAR | 60,0.38.4 | 60,507.3 | 59,526.8 | 58,695.0 | 58,319.4 |
| Ilocos Region | 1.3 | 1.2 | 0.3 | - | - |
| Cagayan Valley | 601.8 | 584.6 | 594.9 | 575.2 | 596.7 |
| Central luzon | - | - | - | 0.1 | 0.1 |
| CALABARZON | 33.4 | 33.3 | 31.1 | 30.3 | 24.7 |
| MIMAROPA | 3.0 | 3.0 | 2.5 | 2.4 | 2.4 |
| Bicol Region | 21.5 | 22.0 | 22.3 | 18.0 | 16.6 |
| Western Visayas | 139.1 | 143.7 | 139.5 | 87.5 | 149.2 |
| Central Visayas | 3,908.7 | 3,632.3 | 3,351.4 | 1,360.5 | 2,766.2 |
| Eastern Visayas | 11.9 | 11.9 | 11.9 | 11.9 | 4.0 |
| Zamboanga Peninsula | 227.2 | 314.9 | 309.8 | 313.3 | 309.2 |
| Northern Mindanao | 1,244.5 | 1,263.8 | 1,231.8 | 1,226.5 | 1,246.9 |
| Davao Region | 1,390.0 | 1,308.8 | 1,279.5 | 1,240.8 | 1,261.9 |
| Soccsksargen | 488.6 | 514.1 | 535.2 | 511.5 | 522.2 |
| CARAGA | 1.4 | 1.3 | - | - | - |
| ARMM | - | - | - | - | - |
- In 2017, Philippine volume of production for carrots decreased by 1.2 percent brought about by the lesser production in Cordillera, CALABARZON, Eastern Visayas and Bicol Region (Table 3).
Figure 3. Carrot Production (%) by Region, Philippines: 2017
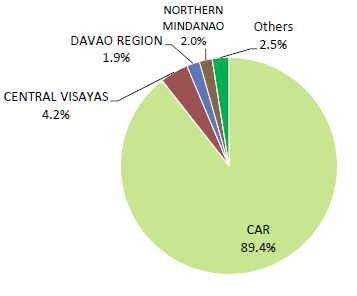
- Cordillera region remained the biggest producer of carrots with 89.4 percent of the country’s total production in 2017. Central Visayas distantly followed with 4.2 percent and Davao and Northern Mindanao with a combined share of 3.9 percent (Figure 3).
Table 4. Habitchuelas Production by Region, Philippines: 2013-2017
| Region | Volume (MT) | ||||
|---|---|---|---|---|---|
| CY 2013 | CY 2014 | CY 2015 | CY 2016 | CY 2017 | |
| PHILIPPINES | 15,423.3 | 15,305.6 | 14,745.3 | 14,388.9 | 14,151.2 |
| CAR | 8,119.8 | 8,092.1 | 7,756.9 | 7,429.3 | 7,169.6 |
| Ilocos Region | 350.2 | 358.0 | 357.6 | 350.5 | 381.2 |
| Cagayan Valley | 2,777.5 | 2,580.2 | 2,471.1 | 2,428.7 | 2,330.2 |
| Central luzon | 45.8 | 44.8 |
44.0 |
41.8 | 42.7 |
| CALABARZON | 191.2 | 192.2 | 209.0 | 190.0 | 209.3 |
| MIMAROPA | - | - | 3.2 | 1.9 | 4.2 |
| Bicol Region | 871.5 | 682.7 | 702.9 | 758.0 | 784.9 |
| Western Visayas | 138.6 | 155.8 | 152.8 | 95.1 | 147.5 |
| Central Visayas | 1,354.2 | 1,592.4 | 1,489.3 | 1,298.7 | 1,492.5 |
| Eastern Visayas | 397.3 | 301.4 | 312.0 | 304.7 | 285.5 |
| Zamboanga Peninsula | 138.8 | 181.5 | 190.5 | 203.6 | 202.7 |
| Northern Mindanao | 611.5 | 665.7 | 584.9 | 589.2 | 627.8 |
| Davao Region | 146.0 | 159.5 | 163.4 | 149.9 | 182.0 |
| Soccsksargen | 245.0 | 259.9 | 226.2 | 209.1 | 224.7 |
| CARAGA | 31.5 | 34.9 | 77.3 | 61.9 | 61.8 |
| ARMM | 4.4 | 4.5 | 4.4 | 4.6 | 4.8 |
- Habitchuelas production went down by 1.7 percent in 2017. The decline in production were recorded by Cordillera, Cagayan Valley, Eastern Visayas, Zamboanga Peninsula and Caraga (Table 4).
Figure 4. Habithuelas Production (%) by Region, Philippines: 2017
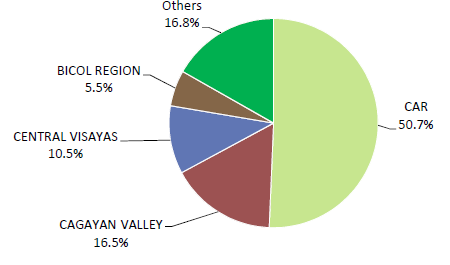
- In 2017, CAR was the top producer of habitchuelas contributing 50.7 percent to the total national output. Other producers included Cagayan Valley with 16.5 percent share, Central Visayas with 10.5 percent, and Bicol Region with 5.5 percent (Figure 4).
Table 5. Chinese Pechay Production by Region, Philippines: 2013-2017
| Region | Volume (MT) | ||||
|---|---|---|---|---|---|
| CY 2013 | CY 2014 | CY 2015 | CY 2016 | CY 2017 | |
| PHILIPPINES | 51,798.2 | 52,243.4 | 51,434.8 | 50,745.5 | 50,265.6 |
| CAR | 45,058.4 | 45,145.3 | 44,676.8 | 43,983.9 | 43,376.0 |
| Ilocos Region | 2.2 | 0.8 | 0.7 | - | - |
| Cagayan Valley | 156.5 | 141.6 | 132.6 | 157.4 | 187.4 |
| Central luzon | - | - |
- |
1.0 | 1.0 |
| CALABARZON | 164.9 | 153.3 | 161.2 | 122.9 | 121.2 |
| MIMAROPA | - | - | - | - | - |
| Bicol Region | - | - | - | - | - |
| Western Visayas | - | - | - | - | - |
| Central Visayas | 3,570.0 | 3,689.4 | 3,471.2 | 3,374.6 | 3,515.4 |
| Eastern Visayas | 1.6 | 1.5 | 2.1 | 1.9 | 0.9 |
| Zamboanga Peninsula | 89.6 | 84.4 | 82.8 | 80.0 | 72.1 |
| Northern Mindanao | 1,992.5 | 2,260.3 | 2,174.8 | 2,183.6 | 2,239.5 |
| Davao Region | 390.7 | 375.2 | 387.4 | 385.3 | 414.0 |
| Soccsksargen | 371.9 | 391.6 | 345.3 | 318.9 | 338.2 |
| CARAGA | - | - | - | - | - |
| ARMM | - | - | - | - | - |
- The country’s Chinese pechay production slightly decreased by 0.95 percent in 2017. This was mainly due to the decrease in production from the country’s top producer, the Cordillera region (Table 5).
Figure 5. Chinese Pechay Production (%) by Region, Philippines: 2017
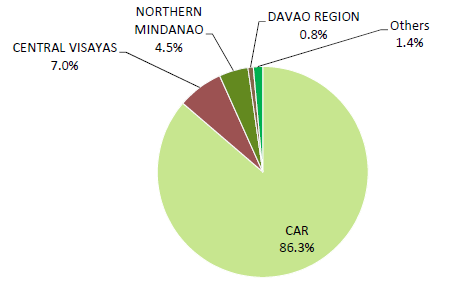
- About 86.3 percent of the country’s total Chinese pechay production came from the Cordillera Administrative Region. Central Visayas came next with 7.0 percent share. Northern Mindanao, Davao Region and the rest of the country had a combined share of 6.7 percent (Figure 5).
Table 6. White potato Production by Region, Philippines: 2013-2017
| Region | Volume (MT) | ||||
|---|---|---|---|---|---|
| CY 2013 | CY 2014 | CY 2015 | CY 2016 | CY 2017 | |
| PHILIPPINES | 117,721.6 | 119,140.0 | 118,479.3 | 116,783.5 | 117,637.3 |
| CAR | 100,758.1 | 102,255.2 | 101,828.5 | 99,980.9 | 100,422.7 |
| Ilocos Region | - | - | - | - | - |
| Cagayan Valley | 427.3 | 448.3 | 419.9 | 459.6 | 466.2 |
| Central luzon | - | - |
- |
- | - |
| CALABARZON | - | - | - | - | - |
| MIMAROPA | - | - | - | - | - |
| Bicol Region | - | - | - | - | - |
| Western Visayas | - | - | - | - | - |
| Central Visayas | 33.7 | 7.2 | 3.7 | - | 0.7 |
| Eastern Visayas | - | - | - | - | - |
| Zamboanga Peninsula | - | - | - | - | - |
| Northern Mindanao | 6,355.0 | 6,145.0 | 5,810.0 | 5,879.2 | 6,034.2 |
| Davao Region | 9,511.4 | 9,633.8 | 9,801.2 | 9,846.2 | 10,044.0 |
| Soccsksargen | 636.2 | 650.6 | 616.1 | 612.2 | 669.6 |
| CARAGA | - | - | - | - | - |
| ARMM | - | - | - | - | - |
- In 2017, Philippine white potato production was recorded at 117,637.3 MT. This was slightly higher by 0.7 percent than the 2016 national output of 116,783.5 MT (Table 6).
Figure 6. White Potato Production (%) by Region, Philippines: 2017
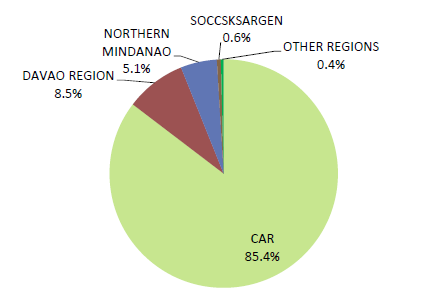
- The bulk of the country’s white potato production came from the Cordillera. In 2017, the region produced 85.4 percent of the national output. This was distantly followed by Davao region with 8.5 percent share, Northern Mindanao with 5.1 percent, SOCCSKSARGEN with 0.6 percent, and the rest of the regions with 0.4 percent share (Figure 6).
Technical Notes
Crops is the cultivated produced of the ground that is grown by farmers.
Production is the quantity produced and actually harvested for a particular crop during the reference period.
Vegetable Crops are mostly temporary crops which are either classified agronomic ally as such or based on purpose for which they are used.
Root Crops are well developed underground edible roots. They are classified into tubers and roots.
Typhoon is an extremely powerful and destructive storm.
Major Crops are the top 20 crops in the Philippines, other than palay and corn which collectively account for more than 60 percent of the total production.
Priority Crops are the identified national banner crops and various regional priority crops of the Key Commercial Crops Development Program (KCCDP), High Value Commercial Crops (HVCC) Program and now the Key Commodity Road Maps of the Department of Agriculture, which are being developed because of their industrial and commercial potentials.
