

Release Date :
Reference Number :
2024CAR11SR-10-047
Table A. Year-on-Year Inflation Rates, All Items
In percent
(2018=100)
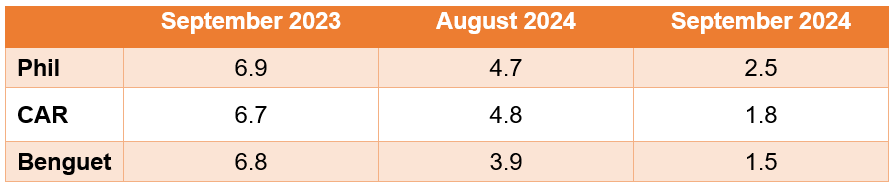
Figure 1. Headline Inflation Rates in Benguet, All Items
(2018=100)
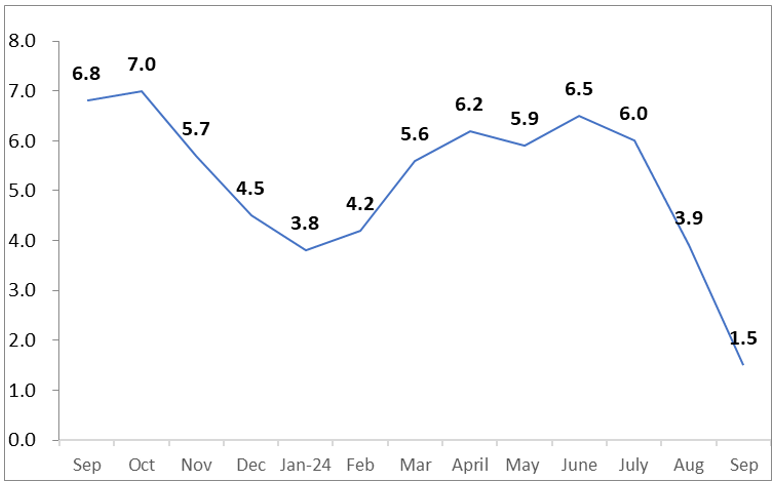
Source: Retail Price Survey of Commodities for the Generation of Consumer Price Index, Philippine Statistics Authority
Table B. Year-on-Year Inflation in Benguet, By Commodity Groups
In percent
(2018=100)
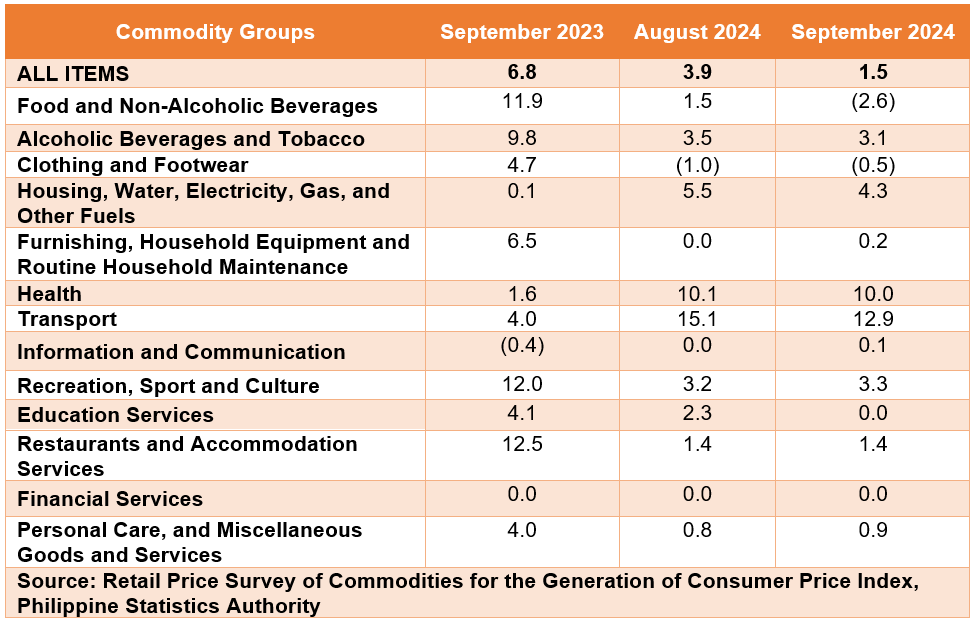
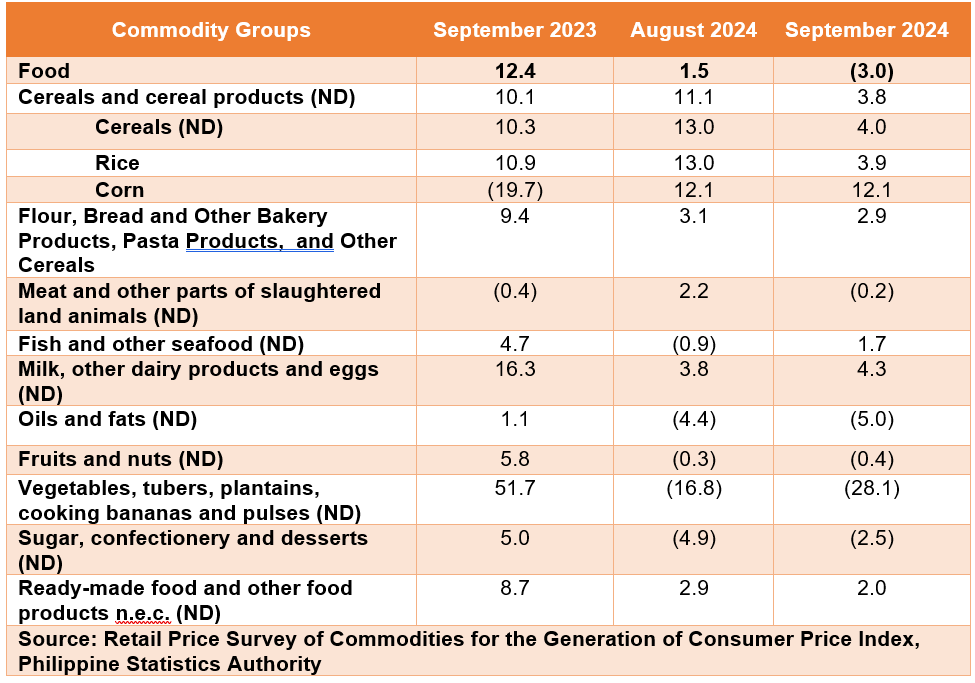
Table C. Year-on-Year Food Inflation in Benguet
In percent
(2018=100)
Benguet
Headline Inflation
The headline inflation or overall inflation of the province for the bottom 30% income household eased to 1.5 percent in September 2024 from 3.9 percent in August 2024. In September 2023, the inflation rate was higher at 6.8 percent. (Figure 1, and Tables A and B)
Main Drivers to the Downward Trend of the Headline Inflation
The downtrend in the overall inflation in September 2024 was primarily brought about by the slower annual increment of food and non-alcoholic beverages at -2.6 percent from 1.5 percent in the previous month. Also contributing to the downtrend were housing, water, electricity, gas and other fuels, and transport with 4.3 percent from 5.5 percent and 12.9 percent from 15.1 percent, respectively
Lower annual increments were also noted in the indices of the following commodity groups during the month:
a. Alcoholic beverages and tobacco, 3.1 percent from 3.5 percent;
b. Health, 10.0 percent from 10.1 percent; and
c. Education Services, 0.0 percent from 2.3 percent.
On the contrary, the index of the following exhibited a higher annual increase during the month:
a. Clothing and footwear, -0.5 percent from -1.0 percent;
b. Furnishings, household equipment and routine household maintenance, 0.2 percent from 0.0 percent;
c. Information and communication, 01. percent from 0.0 percent;
d. Recreation, sport and culture, 3.3 percent from 3.2 percent; and
e. Personal care, and miscellaneous goods and services, 0.9 percent from 0.8 percent.
The indices of the rest of the commodity groups retained their respective previous month’s annual rates.
Main Contributors to the Headline Inflation
The top three commodity groups contributing to the August 2024 overall inflation were the following:
a. Transport with 77.2 percent share or 1.16 percentage point;
b. Housing, water, electricity, gas and other fuels with 75.2 percent share or 1.13 percentage point; and
c. Health with 18.8 percent share or 0.28 percentage points.
Food Inflation
Food inflation at the provincial level for the bottom 30% income household eased to -3.0 percent in September 2024 from 1.5 percent in the previous month. In September 2023, food inflation was higher at 12.4 percent. (Table C)
Main Drivers to the Downward Trend of Food Inflation
The deceleration of food inflation in September 2024 was primarily brought about by the slower inflation rate of cereals and cereal products with 3.8 percent from 11.1 percent in the previous month. This was followed by vegetables, tubers, plantains, cooking bananas and pulses with -28.1 percent and meat and other parts of slaughtered land animals with -0.2 percent.
Moreover, lower inflation rates during the month were noted in the following food groups:
a. Oils and fats, -5.0 percent from -4.4 percent;
b. Fruits and nuts, -0.4 percent from -0.3 percent;
c. Ready-made food and other food products not elsewhere classified, 2.0 percent from 2.9 percent.
In contrast, the following commodity groups registered higher inflation rates during the month:
a. Fish and other seafood, 1.7 percent from -0.9 percent;
b. Milk, other dairy products and eggs, 4.3 percent from 3.8 percent; and
c. Sugar, confectionery and desserts, -2.5 percent from -4.9 percent.
Main Contributors to the Food Inflation
The top three food groups in terms of contribution to the food inflation during the month were the following:
a. Cereals and cereal products, which includes rice, corn, flour, bread and other bakery products, pasta products, and other cereals, -24.19 percentage points;
b. Meat and other parts of slaughtered land animals with a share of 11.41 percentage points; and
c. Fruits and nuts with a share of 4.93 percentage points.
Note: CPIs and inflation rates by region, province and selected city are posted at the PSA website (https://openstat.psa.gov.ph/).
IMELDA L. BUYUCCAN (SGD)
Chief Statistical Specialist
/SMBP
| Attachment | Size |
|---|---|
|
|
1012.43 KB |