

Release Date :
Reference Number :
2025CAR11SR-02-010
Table A. Year-on-Year Inflation Rates, All Items
In percent
(2018=100)
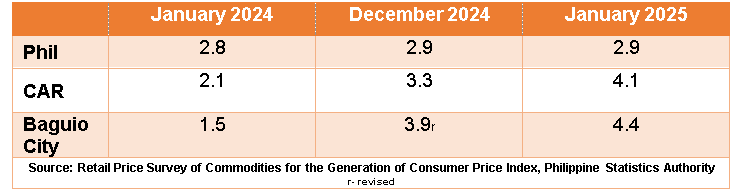
Figure 1. Headline Inflation Rates in Baguio City, All Items
(2018=100)
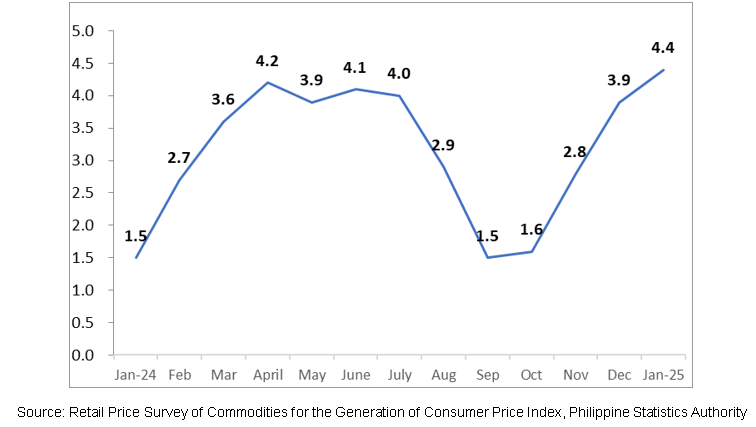
Table B. Year-on-Year Inflation in Baguio City, By Commodity Groups
In percent
(2018=100)
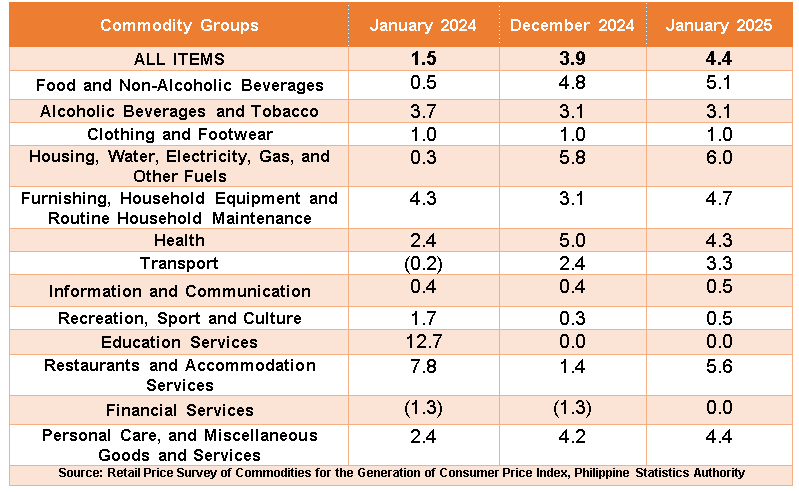
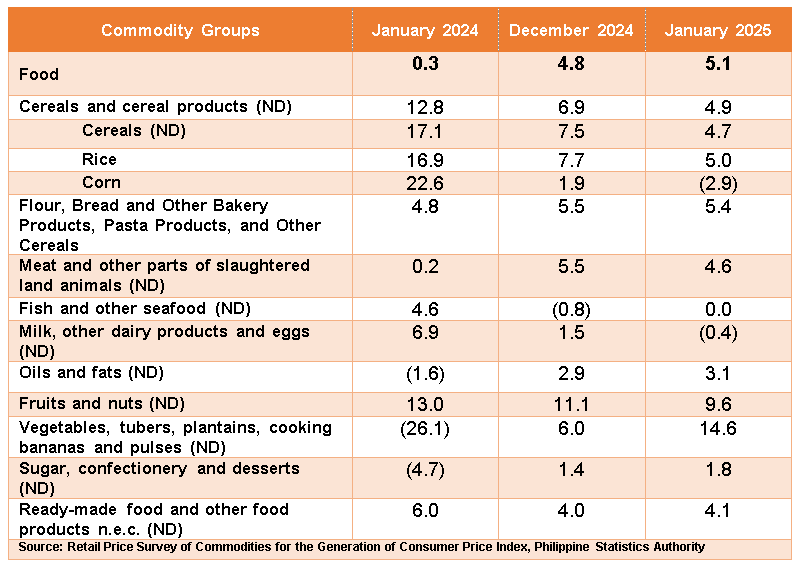
Table C. Year-on-Year Food Inflation in Baguio City
In percent
(2018=100)
Baguio City
Headline Inflation
The headline inflation or overall inflation of the city increased to 4.4 percent in January 2025 from 3.9 percent in December 2024. In January 2024, the inflation rate was 1.5 percent. (Figure 1, and Tables A and B)
Main Drivers to the Upward Trend
The uptrend in the overall inflation in January 2025 was primarily brought about by the higher annual increment of restaurants and accommodation services at 5.6 percent from 1.4 percent in the previous month. Also contributing to the uptrend was transport with 3.3 percent from 2.4 percent, and food and non-alcoholic beverages with 5.1 percent from 4.8 percent.
Higher annual increments were also noted in the index of the following:
a. Housing, water, electricity, gas and other fuels, 6.0 percent from 5.8 percent;
b. Furnishings, household equipment and routine household maintenance, 4.7 percent from 3.1 percent;
c. Information and communication. 0.5 percent from 0.4 percent;
d. Recreation, sport and culture, 0.5 percent from 0.3 percent;
e. Financial services, 0.0 percent from -1.3 percent; and
f. Personal care, and miscellaneous goods and services, 4.4 percent from 4.2 percent.
On the contrary, the index of health exhibited a slower annual increase during the month with 4.3 percent from 5.0 percent. Meanwhile, the indices of the rest of the commodity groups retained their respective previous month’s annual rates.
Main Contributors to the Headline Inflation
The top three commodity groups contributing to the January 2025 overall inflation were the following:
a. Housing, water, electricity, gas and other fuels;
b. Food and non-alcoholic beverages; and
c. Transport.
Food Inflation
Food inflation at the city increased to 5.1 percent from 4.8 percent in the previous month. In January 2024, food inflation was higher at 0.3 percent. (Table C)
Main Drivers to the Upward Trend of Food Inflation
The acceleration of food inflation in January 2025 was primarily brought about by vegetables, tubers, plantains, cooking bananas and pulses with 14.6 percent from 6.0 percent. This was followed by fish and other seafood with 0.0 percent from -0.8 percent, and sugar, confectionery and desserts with 1.8 percent from 1.4 percent.
Moreover, higher inflation rate during the month were also noted on the following:
a. Oils and fats, 3.1 percent from 2.9 percent; and
b. Ready-made food and other food products, 4.1 percent from 4.0 percent.
In contrast, lower inflation rates were noted on the following:
a. Cereals and cereal products, 4.9 percent from 6.9 percent;
b. Meat and other parts of slaughtered animals, 4.6 percent from 5.5 percent;
c. Milk, other dairy products and eggs, -0.4 percent from 1.5 percent; and
d. Fruits and nuts, 9.6 percent from 11.1 percent.
Main Contributors to the Food Inflation
The top three food groups in terms of contribution to the food inflation during the month were the following:
a. Vegetables, tubers, plantains, cooking bananas and pulses;
b. Cereals and cereal products;
c. Meat and other parts of slaughtered land animals.
Note: CPIs and inflation rates by region, province and selected city are posted at the PSA website (https://openstat.psa.gov.ph/).
IMELDA L. BUYUCCAN (SGD)
Chief Statistical Specialist
/SMBP
| Attachment | Size |
|---|---|
|
|
857.18 KB |