

Release Date :
Reference Number :
2024-CARAP-SR12
Inflation Rate decelerated to 3.9 percent in June 2024
Table 1. Year-on-Year Inflation Rates in Apayao Province, All Items in Percent June 2024 (2018=100)
June 2023 | May 2024 | June 2024 | Year-to-date |
4.7 | 4.1 | 3.9 | 5.2 |
Source: Retail Price Survey of Commodities for the Generation of Consumer Price Index, Philippine Statistics Authority
The province’s inflation rate decelerated to 3.9 percent in June 2024 from 4.1 percent in May 2024. It is lower by 0.8 percentage points compared with the same month of the previous year at 4.7 percent and 0.2 percentage points lower than May 2024 at 4.1 percent. (Figure 1 and Table 1)
Figure 1. Year-on Year Inflation Rate, All Items in Percent, June 2023 – June 2024 (2018=100)
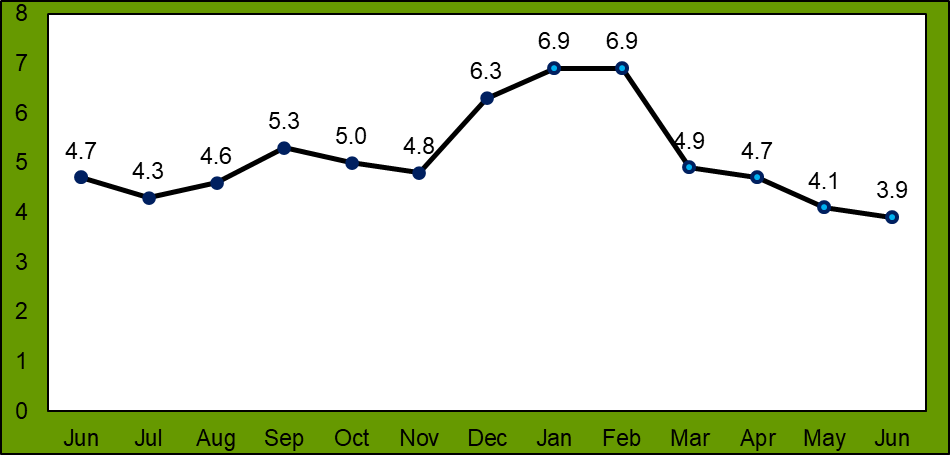
Source: Retail Price Survey of Commodities for the Generation of Consumer Price Index, Philippine Statistics Authority
Table 2. Year-on-Year Consumer Price Index in Apayao, By Commodity Groups in Percent (2018=100)
Commodity Groups | June 2023 | May 2024 | June 2024 |
ALL ITEMS | 120.8 | 125.7 | 125.5 |
I. Food and Non-Alcoholic Beverages | 115.7 | 126.0 | 125.8 |
II. Alcoholic Beverages and Tobacco | 154.2 | 159.9 | 159.5 |
III. Clothing and Footwear | 120.2 | 121.0 | 121.5 |
IV. Housing, Water, Electricity, Gas and Other Fuels | 127.6 | 126.6 | 127.0 |
V. Furnishing, Household Equipment and Routine Household Maintenance | 114.4 | 115.7 | 115.7 |
VI. Health | 113.7 | 114.3 | 114.5 |
VII. Transport | 137.9 | 132.0 | 130.4 |
VIII. Information and Communication | 103.3 | 103.5 | 103.5 |
IX. Recreation, Sport and Culture | 134.5 | 136.4 | 136.3 |
X. Education Services | 109.4 | 109.4 | 109.4 |
XI. Restaurants and Accommodation Services | 150.8 | 157.5 | 157.5 |
XII. Financial Services | 146.0 | 146.0 | 146.0 |
XIII. Personal Care, and Miscellaneous Goods and Services | 116.4 | 117.7 | 117.7 |
Source: Retail Price Survey of Commodities for the Generation of Consumer Price Index, Philippine Statistics Authority
The overall CPI increased from 120.8 of the same months of the previous year to 125.5 on June 2024, representing a 3.9 % inflation rate. The data shows that the value of goods amounting 100 pesos in the base year 2018 values 120.80 pesos in June 2023; 125.70 pesos in May 2024; and 125.50 pesos in June 2024. When the CPI increases, it indicates that the average price level of goods and services has also increased, and vice versa. (Table 2)
Table 3. Year-on-Year Inflation Rates in Apayao, By Commodity Groups in Percent (2018=100)
Commodity Groups | June 2023 | May 2024 | June 2024 |
ALL ITEMS | 4.7 | 4.1 | 3.9 |
I. Food and Non-Alcoholic Beverages | 6.9 | 9.2 | 8.7 |
II. Alcoholic Beverages and Tobacco | 4.0 | 3.8 | 3.4 |
III. Clothing and Footwear | 7.1 | 0.7 | 1.1 |
IV. Housing, Water, Electricity, Gas and Other Fuels | 0.9 | -1.0 | -0.5 |
V. Furnishing, Household Equipment and Routine Household Maintenance | -0.6 | 1.1 | 1.1 |
VI. Health | -0.3 | 0.5 | 0.7 |
VII. Transport | 4.2 | -5.0 | -5.4 |
VIII. Information and Communication | 0.8 | 0.2 | 0.2 |
IX. Recreation, Sport and Culture | 8.0 | 1.5 | 1.3 |
X. Education Services | 0.0 | 0.0 | 0.0 |
XI. Restaurants and Accommodation Services | 11.8 | 4.9 | 4.4 |
XII. Financial Services | 0.0 | 0.0 | 0.0 |
XIII. Personal Care, and Miscellaneous Goods and Services | 2.9 | 1.5 | 1.1 |
Source: Retail Price Survey of Commodities for the Generation of Consumer Price Index, Philippine Statistics Authority
The commodity groups which had the highest percentage share in the downtrend during the period are as follows:
Food and Non-Alcoholic Beverages, which accounted for 8.7 percent and had a 78.0 percent share in the overall trend;
Transport, which accounted for -5.4 percent and had an 11.1 percent share in the overall trend;
Personal Care, Miscellaneous Goods and Services, which accounted for 1.1 percent and had a 6.2 percent share in the overall trend;
Alcoholic Beverages and Tobacco, which accounted for 3.4 percent and had a 2.5 percent share in the overall trend;
Restaurants and Accommodation Services, which accounted for 4.4 percent and had a 1.7 percent share in the overall trend; and
Recreation, Sport, and Culture, which accounted for 1.3 percent and had a 0.5 percent share in the overall trend.
Moreover, the following commodity sub-class which had the highest percent share in the inflation trend during the month of June 2024 are:
1. Rice with 62.3 percent;
2. Mangoes, guavas and mangosteens, fresh with 10.4 percent;
3. Personal grooming treatments with 6.2 percent;
4. Cabbages, fresh or chilled with 2.6 percent;
5. Cigarettes with 2.5 percent;
6. Gasoline with 2.1 percent;
7. Sausages and similar products of meat, offal or blood with 1.8 percent;
8. Tires with 1.7 percent;
9. Restaurants, café and the like - with full service with 1.7 percent;
10. Other parts for personal transport equipment with 1.6 percent;
11. Spark plug with 1.6 percent;
12. Engine overhaul with 1.5 percent;
13. Domestic scheduled air transport fare with 1.4 percent;
14. Tire repair, tire change with 1.2 percent;
15. Other leafy or stem vegetables, fresh or chilled with 0.4 percent;
16. Drawing and painting materials with 0.4 percent;
17. Canned meat with 0.2 percent;
18. Pineapples, fresh with 0.2 percent; and
19. Writing materials with 0.1 percent.
(Figure 2 and Table 3)
Figure 2. Inflation Rate of All Items by Commodity Groups, Comparison Between May 2024 and June 2024
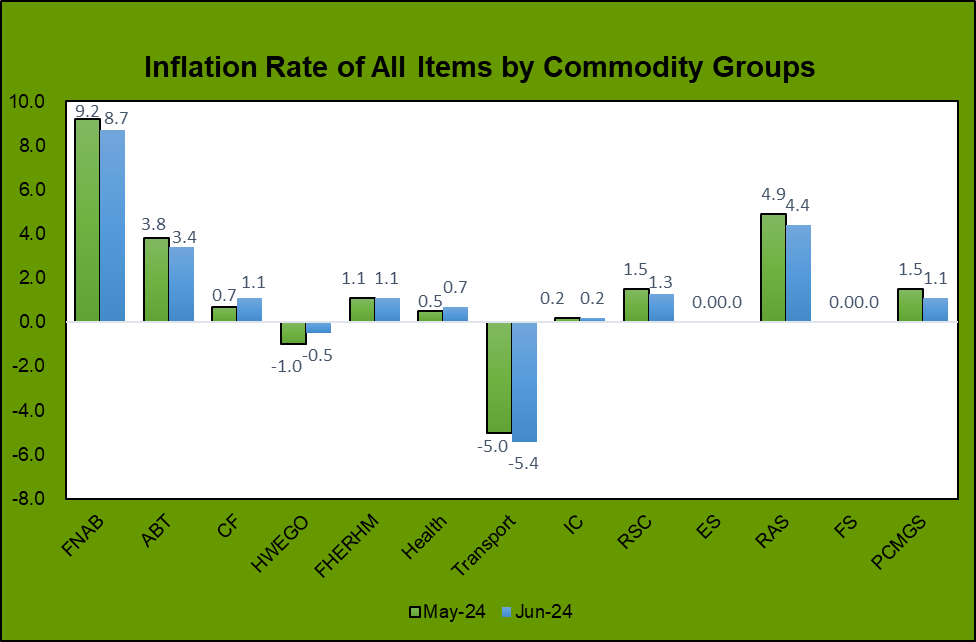
Source: Retail Price Survey of Commodities for the Generation of Consumer Price Index, Philippine Statistics Authority
Purchasing Power of Peso (PPP) recorded at 0.80 in June 2024
Purchasing power of peso continues to weaken through the years and reached 0.80 in June 2024. The PPP of 0.80 implies that the Php1.00 in the base year 2018 values only Php 0.80 in June 2024. A high purchasing power of the peso indicates that the currency can purchase a greater quantity of goods and services. Conversely, a low purchasing power signifies that the currency has depreciated in value and can acquire a reduced amount of goods and services. (Figure 3)
Figure 3. Purchasing Power of Peso in Apayao (2018=100): June 2018 – June 2024
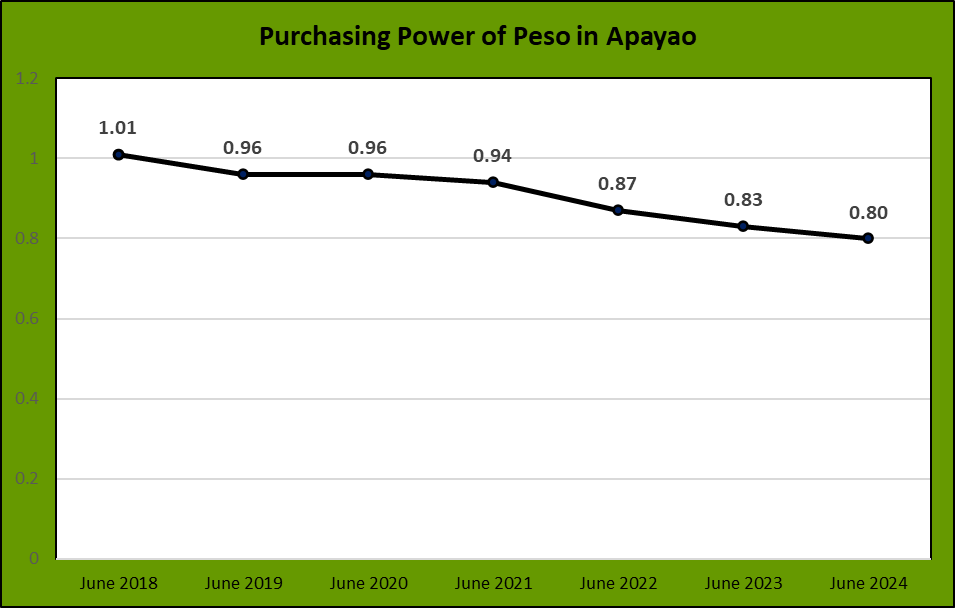
Source: Retail Price Survey of Commodities for the Generation of Consumer Price Index, Philippine Statistics Authority
DEFINITION OF TERMS
Consumer Price Index (CPI) measures the overall change in consumer prices based on a representative basket of goods and services over time.
Inflation refers to an overall increase in the Consumer Price Index (CPI), which is a weighted average of prices for different goods.
Purchasing power of the peso shows how much the peso in the base period is worth in the current period. It is computed as the reciprocal of the CPI for the period under review multiplied by 100.
Commodity Groups are group of goods and services found in the market basket of the province. There are thirteen (13) commodity groups which were arranged according to the PCOICOP.
PCOICOPa detailed classification of individual consumption expenditures on goods and services incurred by the three of the five (5) institutional sectors of the 1993 and 2008 System of National Accounts (SNA), namely: (a) households, (b) financial corporations, (c) non-financial corporations, (d) general government, and (e) non-profit institutions serving households. It stands for Philippine Classification of individual Consumption According to Purpose.
FNAB stands for Food and Non-Alcoholic Beverages
ABT stands for Alcoholic Beverages and Tobacco
CF stands for Clothing and Footwear
HWEGO stands for Housing, Water, Electricity, Gas, and Other Fuels
FHERHM stands for Furnishings, Household Equipment and Routine Household Maintenance
IC stands for Information and Communication
RSC stands for Recreation, Sport, and Culture
ES stands for Education Services
RAS stands for Restaurants and Accommodation Services
FS stands for Financial Services
PCMGS stands for Personal Care, Miscellaneous Goods and Services
Approved by:
GEOFFREY B. CALIMUHAYAN
Chief Statistical Specialist
LSBT
| Attachment | Size |
|---|---|
|
|
334.53 KB |