

Release Date :
Reference Number :
2023-CAR11-655
Consumer Price Index
Consumer Price Index (CPI) is the general measure of the change in the average retail prices of a market basket or collection of goods and services commonly purchased by the average Filipino household.
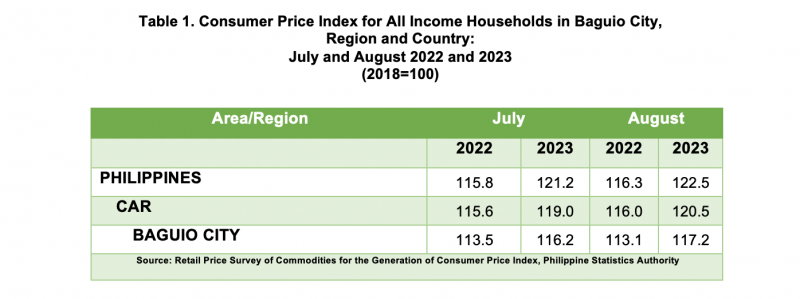
The CPI of the City of Baguio in August 2023 was 117.2. Comparing to July 2023, index for the city increased by 1.0 point.
CPI by Commodity Groups
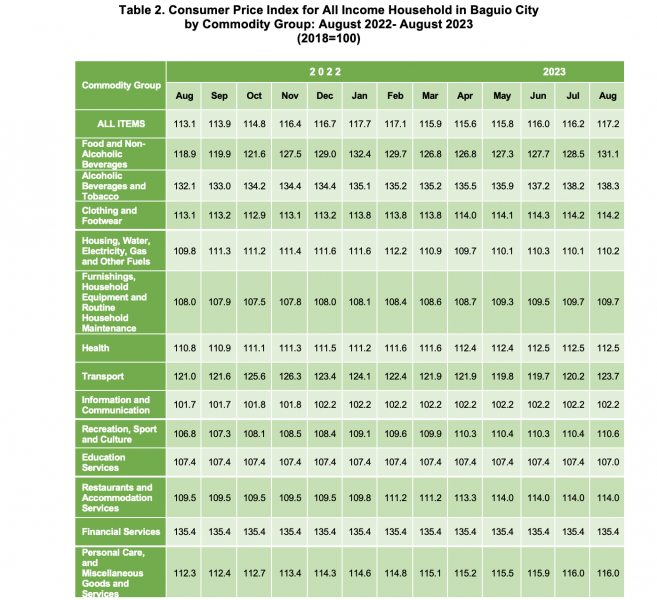
· Among the commodity groups, Alcoholic Beverages and Tobacco still had the highest CPI at 138.3 index points, increased by 0.1 points from the previous month.
· Financial Services still had the second highest CPI at 135.4 index points.
· Food and Non-Alcoholic Beverages remained the third among the commodity groups in the city at 131.1 index points, increased by 2.6 index points.
· Meanwhile, Information and Communication still had the lowest CPI among the commodity groups at the provincial level with 102.2 index points.
Inflation Rate
Inflation is a rise in the general level of prices of goods and services in an economy over a period of time. When the general price level rises, each unit of currency buys fewer goods and services. A chief measure of price inflation is the inflation rate, the annualized percentage change in CPI over time.
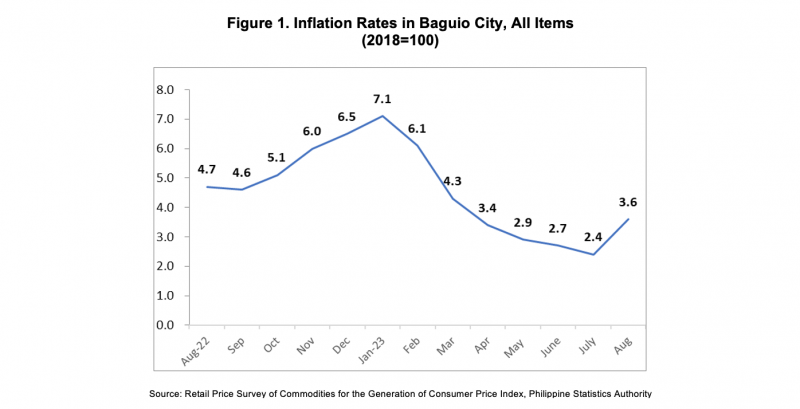
Following the trend of the inflation at the national and regional level, inflation in Baguio City increased to 3.6 percent in August 2023, from 2.4 percent in July 2023. In August 2022, inflation was higher at 4.7 percent.
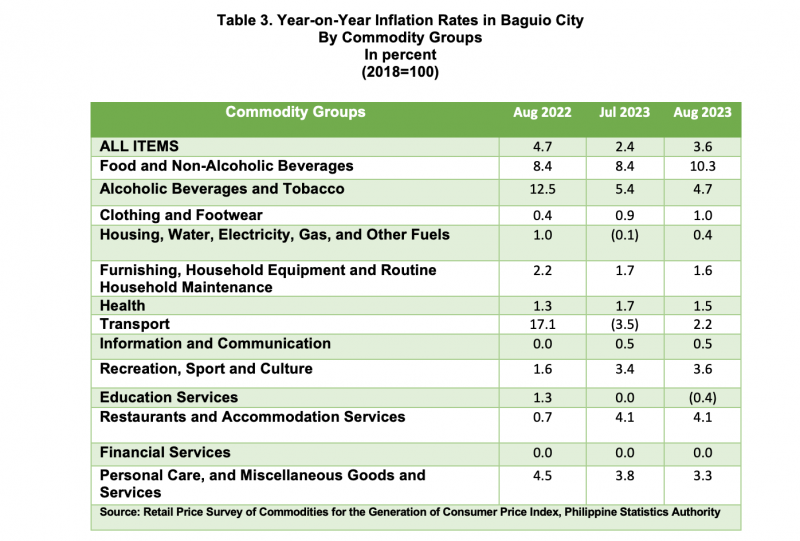
The main driver in the uptrend of inflation in August 2023 was transport at 2.2 percent, from -3.5 percent in July 2023. This was followed by food and non-alcoholic beverages at 10.3 percent, from 8.4 percent, and housing, water, electricity, gas, and other fuels at 0.4 percent, from the -0.1 percent in the previous month.
Relative to their annual rates in the previous month, increases were also observed in the indices of the following commodity groups:
a. Clothing and footwear, 1.0 percent from 0.9 percent; and
b. Recreation, sport and culture, 3.6 percent from 3.4 percent.
On the contrary, decreases were observed in the index of the following:
a. Alcoholic beverages and tobacco, 4.7 percent from 5.4 percent;
b. Furnishing, household equipment and routine household maintenance, 1.6 percent from 1.7 percent;
c. Health, 1.5 percent from 1.7 percent;
d. Education services, -0.4 percent from 0.0 percent; and
e. Personal care, and miscellaneous goods and services, 3.3 percent from 3.8 percent.
Meanwhile, the following commodity groups remained at their previous month’s annual rates
a. Information and communication, 0.5 percent;
b. Restaurants and accommodation services, 4.1 percent; and
c. Financial services, 0.0 percent.
Food inflation at the city level increased to 10.7 percent in August 2023, from 8.7 percent in July 2023. In August 2022, food inflation stood at 8.7 percent.
The higher food inflation was mainly brought about by vegetables, tubers, plantains, cooking bananas and pulses at 43.7 percent this month from the 32.4 percent in July 2023. It was followed by fish and other seafood at 8.9 percent from 4.5 percent, and meat and other parts of slaughtered land animals at 0.2 percent from -0.5 percent of the previous month.
Increases were also observed for the following:
a. Rice, 4.6 percent from 4.2 percent;
b. Corn, 66.8 percent from 56.7 percent; and
c. Flour, bread and other bakery products, pasta products, and other cereals, 11.2 percent from 11.1 percent.
On the other hand, the following food groups had lower rates this month:
a. Milk, other dairy products and eggs, 12.0 percent from 12.1 percent;
b. Oils and fats, 3.3 percent from 4.4 percent;
c. Fruits and nuts, 5.5 percent from 6.6 percent;
d. Sugar, confectionery and desserts, 9.9 percent from 17.4 percent; and
e. Ready-made food and other food products n.e.c, 4.9 percent from 5.9 percent.
Purchasing Power of the Peso (PPP)
Purchasing Power of Peso is a measure of the real value of peso in a given period relative to the base year. The nearer the base year to the current period, the higher the value of the peso derived. As the period goes farther from the base year, the value of peso diminishes as this is “eaten up” by the inflationary factors.
The value of 1 peso in the city was lower at 85 centavos in August 2023. This can be translated that one peso in 2018 was worth 85 centavos in August 2023.
IMELDA L. BUYUCCAN
Chief Statistical Specialist
/SMBP
*****
TECHNICAL NOTES
Consumer Price Index (CPI) is a general measure of the change in the average retail prices of a market basket or collection of goods and services commonly purchased by the average Filipino household.
Inflation Rate (IR) is the rate of change in the average price level between two periods (year-on year/month-on-month as measured by the CPI).
Purchasing Power of the Peso (PPP) measures how much the peso in the reference year is worth in another year.
Base Year (BY) is the reference point of the index number series, at which the index number is set to 100. It is the reference point of the index number series.
The CPI is now rebased from base year 2012 to base year 2018. The rebasing of the CPI is done periodically by the PSA:
1) to ensure that the CPI market basket continues to capture goods and services commonly purchased by households over time;
2) to update expenditure patterns of households; and
3) to synchronize its base year with 2018 base year of the Gross Domestic Product and other indices produced by PSA such as Producer Price Index (PPI) for Agriculture; PPI for Manufacturing; and Value of Production Index (VaPI), Volume of Production Index (VoPI), and Value of Net Sales Index (VaNSI) for Manufacturing.
The rebasing of the CPI is also in accordance with the PSA Board Resolution No.1 Series 2017-146 which approves the synchronized rebasing of the price indices to base year 2006 and every six (6) years thereafter.
Market Basket (MB) is a sample of goods and services used to represent all goods and services produced or bought.
| Attachment | Size |
|---|---|
|
|
3.41 MB |