Release Date :
Reference Number :
SR 2020-34
POULTRY PRODUCTION
- Poultry production includes chicken, duck, chicken egg and duck egg production.
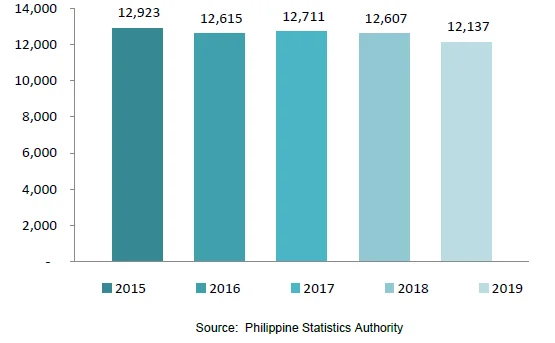
- From 2015 to 2019, highest poultry production was reported in 2015 at 12,923 metric tons (Figure 1) while the lowest was in 2019 at 12,137 metric tons.
- Total poultry production went down in 2019 as compared to 2018 (Figure 1) which was largely attributed to the decrease in broiler production due to shifting to layer farm operation of two large broiler farms in Ifugao.
Figure 1. Total Poultry Production (MT), CAR:
January-December 2015-2019
- In 2019, only chicken posted a decrease in production among the poultry sub-sectors. Duck, chicken egg and duck egg displayed a positive trend (Table 1 and Figure 2).
Table 1. Volume of Poultry Production (MT), by Commodity and by Province, CAR:
January-December 2018-2019
| Region/Province | Chicken | Duck | Chiken Egg | Duck Egg | ||||
|---|---|---|---|---|---|---|---|---|
| 2018 | 2019 | 2018 | 2019 | 2018 | 2019 | 2018 | 2019 | |
| CAR | 7,278 | 6,622 | 759 | 804 | 3,396 | 4,072 | 634 | 639 |
| Abra | 618 | 623 | 11 | 9 | 333 | 328 | 37 | 38 |
| Apayao | 687 | 732 | 89 | 73 | 117 | 160 | 69 | 74 |
| Benguet | 1,031 | 1,025 | 13 | 11 | 969 | 963 | 17 | 17 |
| Ifugao | 4,125 | 3,457 | 398 | 457 | 1,674 | 1,779 | 267 | 254 |
| Kalinga | 343 | 436 | 221 | 231 | 385 | 402 | 232 | 245 |
| Mountain Province | 384 | 350 | 27 | 23 | 458 | 440 | 12 | 11 |
Figure 2. Volume of Poultry Production (MT) , by
Commod i t y CAR: 2 0 1 8 -2 01 9
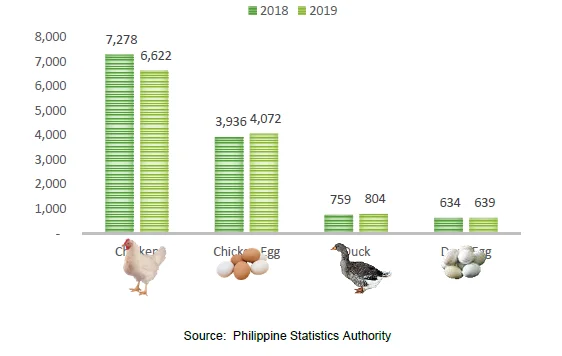
Figure 3. Percent Distribution of Poultry Production by Commodity,
CAR: 2019
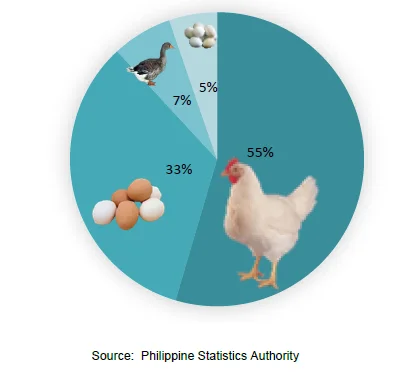
- Of the total poultry production, 55 percent came from chicken production, 33 percent from chicken egg and the remaining 12 percent from duck and duck egg (Figure 3).
POULTRY INVENTORY
Chicken
- As of January 1, 2020, the total chicken inventory in the region was estimated at 1,563,123 birds, a decline of 17.9 percent compared with the same reference period in 2019.
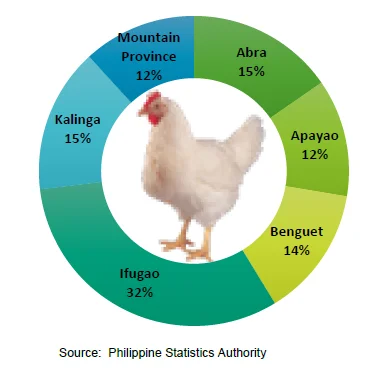
- Among the provinces of CAR, the highest inventory of chicken was recorded in Ifugao with 497,783 birds (Table 2) or 32 percent of the total chicken inventory in the region (Figure 4). It also displayed the biggest decrease at 37.8 percent.
Table 2. Chicken Inventory (No. of Birds) by Province, CAR:
As of January 1, 2019 and 2020
| Region | Chicken | % Change | |
|---|---|---|---|
| 2019 | 2020 | ||
| CAR | 1,903,464 | 1,563,123 | (17.9) |
| Abra | 258,927 | 240,098 | (7.3) |
| Apayao | 166,658 | 191,800 | 15.1 |
| Benguet | 222,313 | 213,162 | (4.1) |
| Ifugao | 800,670 | 497,783 | (37.8 |
| Kalinga | 268,619 | 235,940 | (12.2) |
| Mountain Province | 186,277 | 184,340 | (1.0) |
Figure 4. Percent Distribution of Total Chicken Inventory by
Province, CAR: As of January 1, 2020
Duck
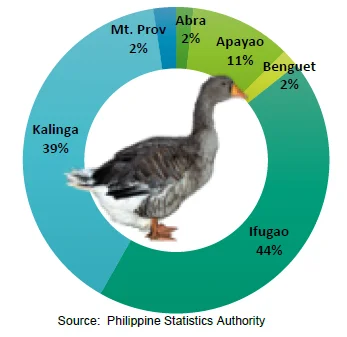
- As of January 1, 2020, the total duck inventory in the region was estimated at 301,724 birds, a minimal increase of 0.1 percent compared with same reference period in 2019.
- Among the provinces of CAR, the highest inventory of duck was recorded in Ifugao with 132,397 birds (Table 3) or 44 percent of the total duck population in the region (Figure 5). This was followed by Kalinga with 118,916 birds or an equivalent of 39 percent share to the total.
Table 3. Duck Inventory (No. of Birds) by Province, CAR:
As of January 1, 2019 & 2020
| Region | Duck | % Change | |
|---|---|---|---|
| 2019 | 2020 | ||
| CAR | 301,335 | 301,724 | 0.1 |
| Abra | 5,340 | 5,500 | 3.0 |
| Apayao | 26,526 | 32,150 | 21.2 |
| Benguet | 5,534 | 5,592 | 1.0 |
| Ifugao | 134,081 | 132,397 | (1.3) |
| Kalinga | 123,181 | 118,916 | (3.5) |
| Mountain Province | 6,673 | 7,169 | 7.4 |
Figure 5. Percent Distribution of Duck Inventory by
Province, CAR: As of January 1, 2019 & 2020
Province, CAR: As of January 1, 2019 & 2020
