

Release Date :
Reference Number :
2023-CAR11-506
1. Philippines
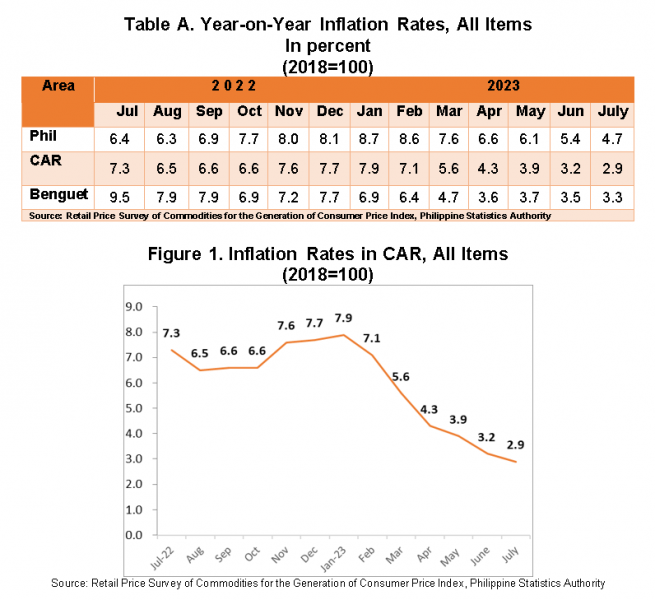
The Philippines’ headline inflation or overall inflation slowed down further to 4.7 percent in July 2023 from 5.4 percent in June 2023. This is the sixth consecutive month of deceleration in the headline inflation and the lowest since March 2022 with an inflation rate of 4.0 percent. The average inflation rate from January to July 2023 stood at 6.8 percent. In July 2022, the inflation rate was recorded at 6.4 percent.
The continued downtrend of overall inflation in July 2023 was primarily brought about by the slower year-on-year increase in housing, water, electricity, gas and other fuels at 4.5 percent during the month from 5.6 percent in June 2023. The slower annual increment observed in the heavily-weighted food and non-alcoholic beverages at 6.3 percent in July 2023 from 6.7 percent in the previous month also contributed to the downward trend of headline inflation. The third main source of deceleration was transport, recording a faster annual decrease of -4.7 percent during the month from -3.1 percent in June 2023.
Compared with their previous month’s inflation rates, slower annual increments were noted in the indices of the following commodity groups during the month:
- Alcoholic beverages and tobacco, 10.9 percent from 11.6 percent;
- Clothing and footwear, 4.8 percent from 5.1 percent;
- Furnishings, household equipment and routine household maintenance, 5.8 percent from 6.0 percent;
- Recreation, sport and culture, 4.7 percent from 4.8 percent;
- Restaurants and accommodation services, 7.9 percent from 8.2 percent; and
- Personal care, and miscellaneous goods and services, 5.6 percent from 5.8 percent.
On the contrary, the index of education services exhibited a faster year-on-year increase at 3.7 percent during the month from 3.6 percent in June 2023.
Meanwhile, the indices of the rest of the commodity groups retained their respective previous month’s annual growth rates.
The top three commodity groups contributing to the July 2023 headline inflation were the following:
- Food and non-alcoholic beverages with 50.0 percent share or 2.4 percentage points;
- Housing, water, electricity, gas and other fuels with 20.2 percent share or 1.0 percentage point; and
- Restaurants and accommodation services with 16.0 percent share or 0.8 percentage point.
2. Cordillera Administrative Region (CAR)
Inflation in the region further slowed down to 2.9 percent in July 2023, from 3.2 percent in June 2023. In July 2022, inflation was observed at 7.3 percent.
Lower inflation rate in transport at -5.5 percent from -2.8 percent in June 2023 was the main driver in the downtrend of inflation. This was followed by housing, water, electricity, gas and other fuels at 0.1 percent, from 0.2 percent, and restaurants and accommodation services at 5.5 percent, from 6.0 percent in the previous month.
Also contributed to the downtrend are the following:
- Alcoholic beverages and tobacco, 6.9 percent from 8.1 percent;
- Clothing and footwear, 3.7 percent from 4.1 percent;
- Furnishing, household equipment and routine household maintenance, 3.9 percent from 4.2 percent;
- Health, 2.9 percent from 3.2 percent;
- Recreation, sport and culture, 4.3 percent from 5.0 percent; and
- Personal care, and miscellaneous goods and services, 4.1 percent from 4.5 percent.
On the other hand, only food and non-alcoholic beverages had an increase in inflation rate to 7.2 percent this month, from the 6.6 percent in June 2023. Information and communication, education services, and financial services had the same inflation rate from the previous month.
3. Benguet
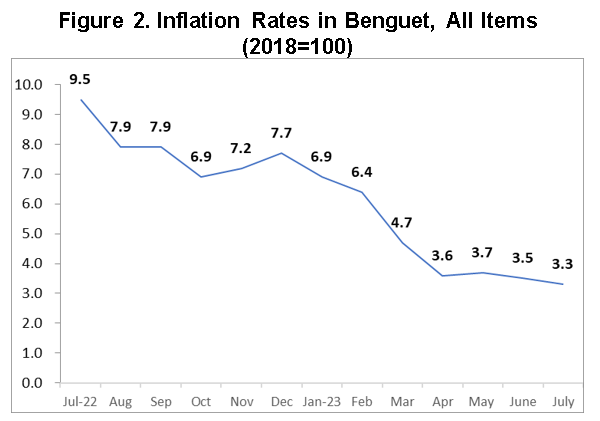
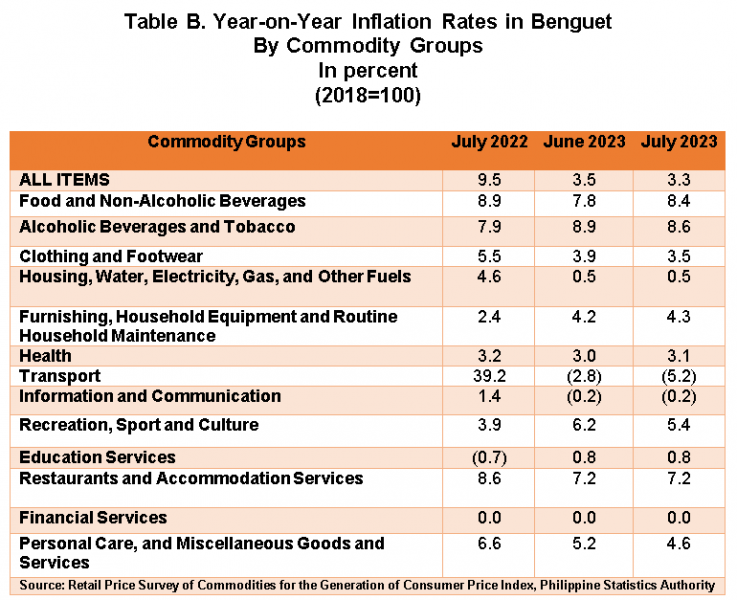
Following the trend of the inflation at the national and regional level, inflation in Benguet decreased to 3.3 percent in July 2023, from 3.5 percent in June 2023. In July 2022, inflation was higher at 9.5 percent. (Table B and Figure 2)
The main driver in the downtrend of inflation in July 2023 was transport at -5.2 percent, from -2.8 percent in June 2023. This was followed by personal care, and miscellaneous goods and services at 4.6 percent, from 5.2 percent, and clothing and footwear at 3.5 percent, from the 3.9 percent in the previous month.
Relative to their annual rates in the previous month, decreases were also observed in the indices of the following:
- Alcoholic beverages and tobacco, 8.6 percent from 8.9 percent; and
- Recreation, sport and culture, 5.4 percent from 6.2 percent.
On the contrary, increases were observed in the index of the following:
- Food and non-alcoholic beverages, 8.4 percent from 7.8 percent;
- Furnishings, household equipment and routine household maintenance, 4.3 percent from 4.2 percent; and
- Health, 3.1 percent from 3.0 percent.
Meanwhile, the following had the same inflation rates from the previous month (Table 3):
- Housing, water, electricity, gas and other fuel;
- Information and communication;
- Education services;
- Restaurants and accommodation services; and
- Financial services.
Food inflation at the provincial level increased to 8.8 percent in July 2023, from 8.0 percent in June 2023. In July 2022, food inflation stood at 9.3 percent. (Table 5,9)
The higher food inflation was mainly brought about by vegetables, tubers, plantains, cooking bananas and pulses at 39.9 percent, from 20.4 percent in June 2023. It was followed by ready-made food and other food products n.e.c, at 6.5 percent, from 5.8 percent in the previous month.
Meanwhile, lower annual growth rates were observed in the indices of the following food groups in July 2023:
- Rice, 2.1 percent from 3.1 percent;
- Corn, -19.7 percent from -14.9 percent;
- Flour, bread and other bakery products, pasta products, and other cereals, 9.9 percent from 10.4 percent;
- Meat and other parts of slaughtered animals, -1.6 percent from 0.8 percent;
- Fish and other seafood, 4.3 percent from 5.2 percent;
- Milk, other dairy products and eggs, 13.3 percent from15.3 percent;
- Oils and fats, 6.8 percent from 10.7 percent;
- Fruits and nuts, 6.7 percent from 7.2 percent; and
- Sugar, confectionery and desserts, 28.9 percent from 32.7 percent.
Note: CPIs and inflation rates by region, province and selected city are posted at the PSA website (https://openstat.psa.gov.ph/).
IMELDA L. BUYUCCAN
Chief Statistical Specialist
/SMBP
| Attachment | Size |
|---|---|
|
|
227.86 KB |