

Release Date :
Total population of Atok increase at 426 person
- Atok posted a total population of 19,668 persons as of August 1, 2015 based on the 2015 Census of Population (POPCEN 2015). This was higher by 426 persons over the 2010 census figure of 19,242 and by 3,011 persons compared with the population of 16,657 in 2000.

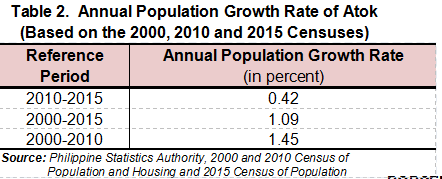
Atok population growth rate at 0.42 percent
- The annual population growth rate (PGR) of Atok for the period of 2010 to 2015 is 0.42 percent from 1.45 percent PGR recorded for the period of 2000-2010. This means that there were approximately one person added per year for every 100 persons in the population.
Paoay had the highest total population among the barangay
- Among the eight barangays of the municipality of Atok, Paoay reported the highest population count with 4,395 persons which accounted almost one-fourth (22.4%) of the total
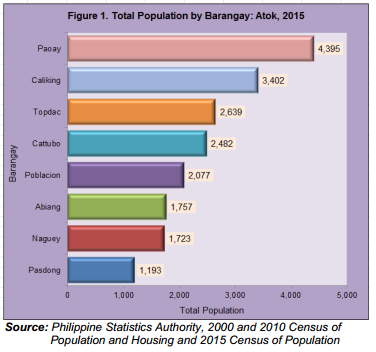 population of the municipality. This was followed by barangay Caliking and Topdac with 3,402 (17.3%) and 2,639 (13.4%) persons, respectively. On the other hand, Pasdong had the least total population with 1,193 persons (6.07%) in the barangay.
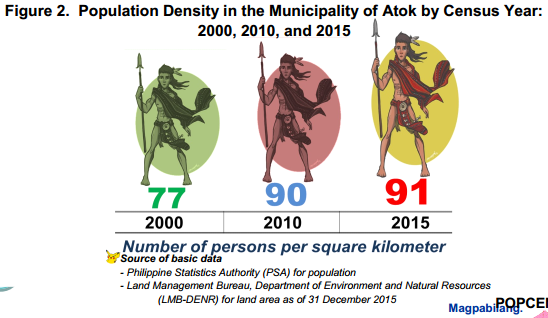
Population density in the municipality of Atok increases from 90 to
91 persons per square kilometer
* With a land area of approximately 214.99 square kilometers, the population
density of the municipality in 2015 was posted at 91 persons per square
kilometer. This represents an increase of one person per square
kilometer from the population density of 90 persons per square kilometer in 2010. In 2000, there were 77 persons residing in every square kilometer of the municipality.
Household population comprises 99.49 percent of the total population
- The household population of the municipality of Atok reached 19,567 persons in 2015. This is higher by 371 persons over the 2010 census figure of 19,196, and 2,919 more than the 16,648 household population posted in 2000.
- The household population comprised 99.49 percent of the total population in the municipality while the remaining 0.51 percent was accounted by the institutional population or whose usual place of residence are institutional living quarter such as as hotels, lodging houses, and dormitories; hospitals and nurses’ homes; orphanages and welfare institutions; corrective and penal institutions; convents, nunneries, seminaries, and boarding schools; military camps; logging, mining, construction and public works camps; oceangoing, interisland, and coastal vessels; and refugee camps.
| Attachment | Size |
|---|---|
|
|
1.45 MB |