

Release Date :
Reference Number :
SR 2019-13
Foreign trade is the system by which countries exchange goods and services. Countries trade with each other to obtain things that are of better quality, less expensive or simply different from goods and services produced at home. The goods and services that are bought from other countries are called imports. Foreign trade has a significant share of the region’s Gross Regional Domestic Product (GRDP) and the country’s Gross Domestic Product (GDP).
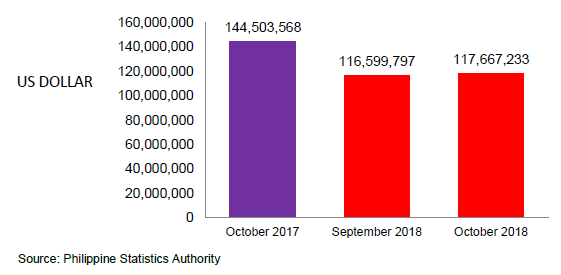
Imports at $117.7 million
- The Free on Board (FOB) value of import goods of the Cordillera Administrative Region (CAR) in October 2018 was recorded at $117,667,233.
-
On quarter-on-quarter basis, imports in October 2018 declined by 19.0 percent as compared to $144,503,568 recorded purchase in the same period in 2017.
-
On monthly basis, the value of imports increased by 0.92 percent from the amount of $116,599,797 recorded in September 2018.
Figure 1. Free on Board Value of Imports, CAR:
October 2017, September 2018, October 2018
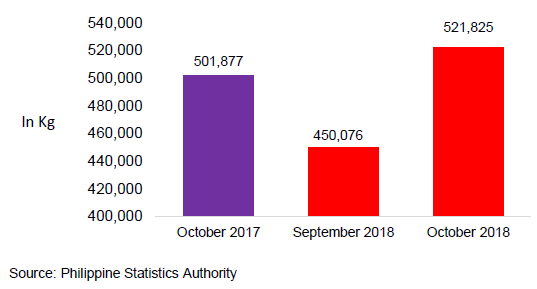
- In October 2018, the region’s total comsumption volume of imports was recorded at 521,825.0 kilograms (kg). The volume of imports increased in October 2018 as compared to the volume of 501,877.2 kg consumed in same month last year. Also it increased by 15.9 percent as compared to 450,076.2 kg produced in September 2018.
Figure 2. Consumption Volume of Imports, CAR:
October 2017, September 2018, October 2018
Imports by Commodity
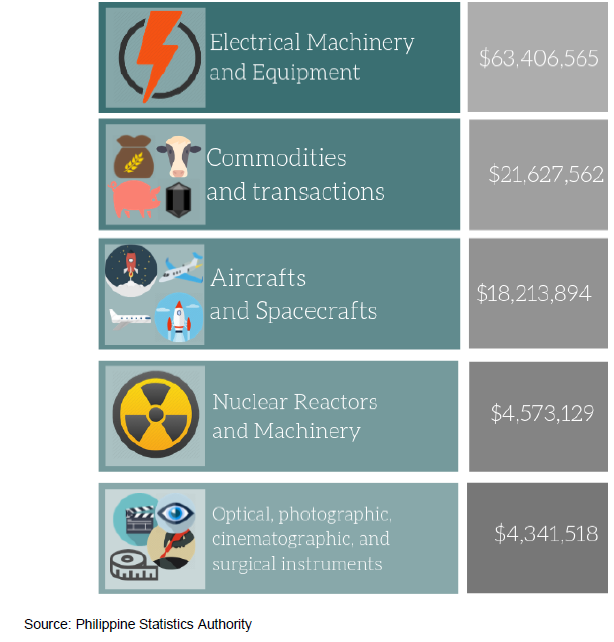
- Total payment for the region’s top five imports for 2018 reached $112,162,668 or 95.3 percent of the total import value, registering a drop of 19.8 percent from $139,874,677 in 2017.
- Electrical machinery and equipment and parts thereof, accounting for 53.9 percent of the total FOB posted a decrease of 13.7 percent from $73,443,581 in 2017 to $63,406,565 in 2018.
- Commodities and transactions not classified elsewhere ranked second with 18.5 percent share of the total FOB worth $21,627,562 lower by 31.4 percent from $31,545,125 in 2017.
- Aircraft, spacecraft, and parts thereof which ranked third, shared 15.5 percent, posting a decrease of 4.1 percent or $18,213,894 in 2018 from $18,996,991 recorded value in 2017.
- Nuclear reactors, boilers, machinery and mechanical appliance ranked fourth with 3.9 percent share, decreasing by 42.7 percent from $7,976,607 in 2017 to $4,573,129 in 2018.
-
Optical, photographic, cinematographic, measuring, checking, precision, medical or surgical instruments and apparatus ranked fifth, comprising 3.7 percent of the total imports. This decreased by 45.1 percent from $7,912,677 in 2017 to $4,341,581 in 2018.
-
Rounding up the list for the top imports in October 2018 were Plastics and articles thereof with imports value of $1,423,745 declining by 75.7 percent; Natural or cultured pearls, precious or semi-precious stones, precious metals clad with precious metals and articles thereof; Imitation jewellery; coin with $428,247 increasing by 24.2 percent; and Miscellaneous chemical products with $345,368 imports value rising by 0.3 percent.
Figure 3.Top 5 Imports, CAR: October 2018
(In USD)
Imports by Country
- The country’s top ten import sources for October 2018 posted a total import value of $112,999,346 or 96.0 percent of the total trade.
- Korea was the region’s top source of imports in October 2018, accounting for a total of $43,511,436 or 37.0 percent of the total value of imports. Majority of the imported products from Korea were electrical machinery and equipment and parts thereof; sound recorders and reproducers, television image and sound recorders and reproducers and parts and accessories of such articles billed at $42,021,233 or 35.7 percent and aircraft, spacecraft, and parts thereof with $528,504 or 0.5 percent.
- USA ranked as the region’s second largest source of imports with a total value of $29,469,078 or 25.0 percent of the total FOB. Imported goods purchased from USA consisted of commodities and transactions not classified elsewhere (reserved for special uses by contracting parties) worth $11,412,251 or 9.6 percent of the region’s total imports. Aircraft, spacecraft, and parts thereof ranked the second highest import from USA with $9,864,929 or 8.4 percent.
Figure 4.Top 10 Country of Source of Imports, CAR:
October 2018
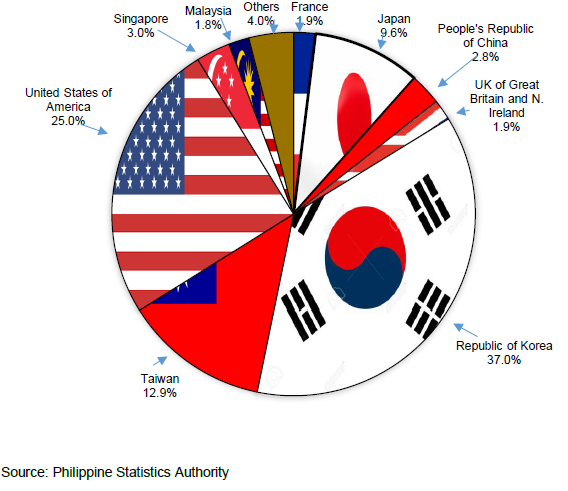
- Taiwan ranked third accounting $15,185,591 or 12.9 percent of total imports in October 2018. Major imports from Taiwan were commodities and transactions not classified elsewhere (reserved for special uses by contracting parties) with purchases worth $8,258,643 or 7.0 percent of the total. Electrical machinery and equipment and parts thereof; sound recorders and reproducers, television image and sound recorders and reproducers and parts and accessories of such articles came second valued at $5,657,132 or 4.8 of the total.
- Japan ranked as fourth with total imports amounting $11,332,581 or 9.6 percent of the total FOB. Electrical machinery and equipment and parts thereof; sound recorders and reproducers, television image and sound recorders and reproducers and parts and accessories of such articles with import bill of $7,397,020 or 6.3 percent and optical, photographic, cinematographic, measuring, checking, precision, medical or surgical instruments and apparatus worth $1,489,543 or 1.2 percent share were the major imports from Japan.
- Singapore and China tied as the fifth top import source for the region with a total imports of $3,585,480 or 3.0 percent and $3,299,807 or 2.8 percent, respectively. The top import goods from Singapore were Aircraft, spacecraft, and parts thereof amounting $1,070,646 or 0.9 percent and electrical machinery and equipment and parts thereof; sound recorders and reproducers, television image and sound recorders and reproducers and parts and accessories of such articles amounting $804,980 or 0.7 percent.
- The top import items from China were electrical machinery and equipment and parts thereof; sound recorders and reproducers, television image and sound recorders and reproducers and parts and accessories of such articles worth $1,402,465 or 1.19 percent and aircraft, spacecraft, and parts thereof worth $1,059,940 or 0.90 percent.
Technical Notes
-
Free on Board Value - is the value of the goods free on board the carrier at the frontier of the exporting country. It includes inland freight, export duty and other expenses. Ocean freight, insurance and consular fees, however, is excluded. These FOB values are obtained directly from the source documents. However, for cases where the FOB values declared in the source documents are not in US dollars, these values are converted to US dollars. The average US dollar rate for the month which is computed as the total daily rate of transactions divided by the number of working days in a month is used in converting FOB value to FOB US dollar value.
-
Country of Destination (Exports only) - it is the country of ultimate destination/shipment. It is not necessarily the country where the commodity/shipment is to be unloaded, as in the case of shipment unloaded from one ocean liner but is destined to a country that is landlocked. In which case, the country of destination is the landlocked country.
-
Country of Origin (Imports only) - it is the country where the commodity is mined, grown, or manufactured. Further processing or material added to it in another country must bring about a material transformation to render such country as the country of origin. The country of origin remains unchanged if the commodity is subjected to mere sorting, grading, cleaning, packaging or similar processing.
-
Exports - the goods and services that are sold to other countries.
-
Imports - the goods and services that a country buys from other countries.
-
Philippine Standard Commodity Classification - is used to classify the imported commodities at the most detailed level for statistical purposes.
-
Sources of Information - foreign trade statistics are compiled by the National Statistics Office, now the Philippine Statistics Authority, from copies of import and export documents submitted by importers and exporters or their authorized representatives to the Bureau of Customs as required by law.
| Attachment | Size |
|---|---|
|
|
387.91 KB |