

Release Date :
Reference Number :
SR 2019-36
The Labor Force Survey (LFS) provides a snapshot or the stock of economically active persons in the country at a point or reference period. It aims to monitor the changes in the employment status of persons in the working age population (employed, unemployed and not in the labor force) during a specified period using the Labor Force Framework.
The LFS concept and measurement follows the international standards concerning statistics of the economically active population, employment, unemployment and underemployment adopted by the 13th International Conference of Labour Statisticians (ICLS) in October 1982 at Geneva, Switzerland.
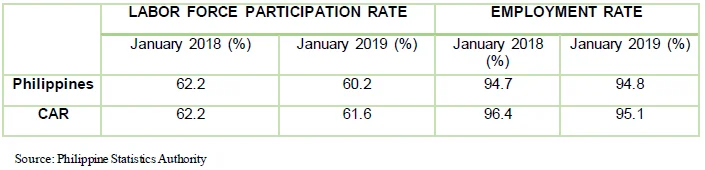
Labor Force Participation Rate (LFPR) in CAR is 61.1%
- The result for the January 2019 Labor Force Survey showed that the Cordillera Administrative Region’s labor force participation rate of persons whose age is 15 years old and over was estimated at 61.1 percent or about 792 thousand individuals.
- Along with other regions, Cordillera Administrative Region (CAR) had an LFPR higher than the national rate of 60.2 percent. From 62.2 percent in January 2018 it dropped by 1.1 percent in January 2019.
Figure 1. Percentage of Persons in the Labor Force of the
Philippines: January 2019

Employment rate in CAR decreased by 1.3%
- There was a slight decrease in the number of employed persons from 96.4 percent in January 2018 to 95.1 percent in January 2019.
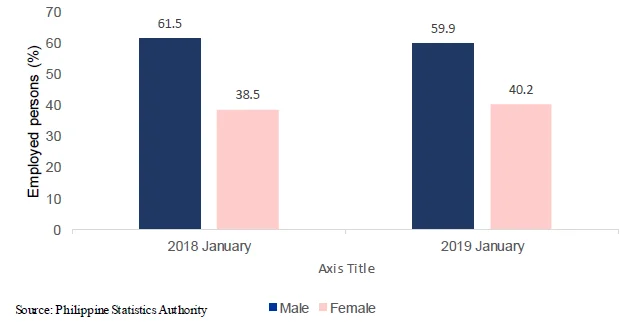
More males are employed in CAR
- Of the 753,164 employed persons in CAR in January 2019, 59.9 percent or about 451,522 individuals were males, while 40.2 percent or about 302,772 individuals were females.
- There was a decrease in the number of employed males in the region by 1.0 percent. decrease in males corresponded to the increase in the percentage of employed females in the region.
Figure 2: Percentage Distribution of Employed Persons by Sex,
CAR: January 2018 & January 2019
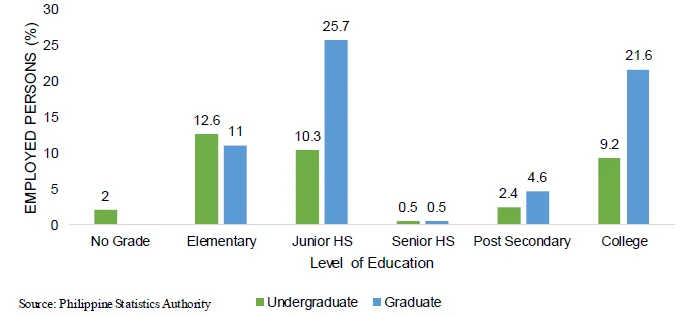
More than a third of employed have high school education
- In terms of educational attainment of employed persons, 36.0 percent had junior high school of education of which 25.7 percent graduated while 10.3 percent did not graduate.
- Employed persons with college education followed with 30.3 percent of the total employed persons in the region. Of these, 21.6 percent are degree holder while 9.2 percent did not finish college.
-
With a share of 23.6 percent of employed persons, elementary level education came third of the total employed persons in the region. Of which 11.0 percent graduated and 12.6 percent did not graduate.
-
Employed persons with Post-Secondary level education accounted to only 7.0 percent of the total employed persons in the region. There were 4.6 employed persons who graduated while 2.4 percent were undergraduates.
-
For January 2019, employed persons in CAR with no education or grade level completed was at 2.0 percent. This level had the lowest incidence of employment in the region.
Figure 3. Employed Persons by Highest Grade Completed, CAR:
January 2019
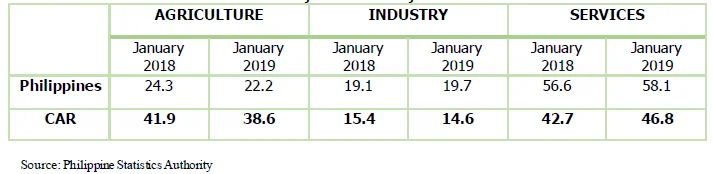
Services sector employs the most
- By sector, the Services Sector employed the most at 46.8 percent, followed by Agriculture sub-industry by 38.6 percent and Industry at 14.6.
- Agriculture and Forestry continued to be the biggest employer in the region by major industry group with 38.4 percent share in January 2019.
-
With a share of 13.3 percent of the total employed persons in January 2019, wholesale and retail trade; repair of motor vehicles and motorcycles ranked as the second largest major industry group in the region.
-
Only 3.0 of the total employed persons in the region in January 2019 works in Manufacturing considering that this sub-industry contributes the most to the regional economy.
Table 2. Percentage Distribution of Employed Persons by Major Industry Groups in CAR:
July 2017 and July 2018
July 2017 and July 2018
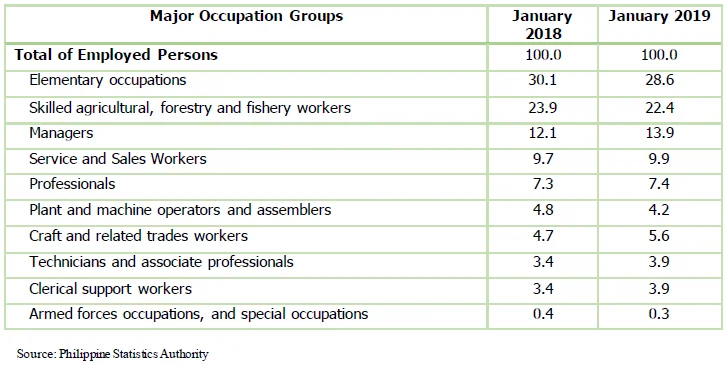
Elementary occupations comprise 28.6%
- Among the occupation groups, elementary occupations were the largest group of employed persons in CAR comprising 28.6 percent of the total regional employment in January 2019. This decreased by 1.5 percentage points compared to same period last year.
-
On the second largest occupation group, skilled agricultural, forestry and fishery workers share a 22.4 percent of the total employed persons in the region in January 2019. This group decreased by 1.5 percentage points from January 2018.
-
Managers made up the third largest occupation group within the region with 11.5 percent total employed persons in January 2019.
-
The rest of the major occupation groups comprised 35.1 percent of the total employed persons in the entire labor force of the region.
Table 3. Distribution of Employed Persons by Major Occupation Groups in CAR:
January 2018 and January 2019
Underemployment at 18.0%
- The underemployment rate of CAR was 15.5 percent of which 6.6 percent of the underemployed persons already worked 40 hours per week and over or those invisibly underemployed.
- Meanwhile, those who work less than 40 hours a week or those visibly underemployed accounted for 8.9 percent of the total underemployed population in the region.
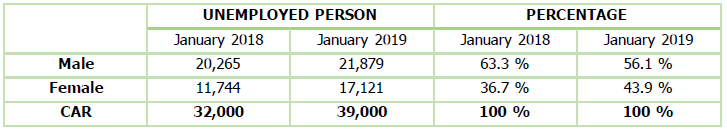
Region’s unemployment increased at 1.3%
- Unemployment rate in the region increased by 1.3 percentage point, from 3.6 percent in January 2018 to 4.9 percent in January 2019.
- The unemployed male population accounted for 56.1 percent of the total unemployed persons in the region, while 43.9 percent were unemployed females.
| Attachment | Size |
|---|---|
|
|
294.48 KB |