

Release Date :
Reference Number :
2024-30
Table 1. Year-on-Year Inflation Rates, All ltems, Ifugao
ln percent
(2018=100)
Area | June 2023 | May 2024 | June 2024 |
CAR | 3.2 | 4.4 | 4.6 |
IFUGAO | 3.2 | 5.7 | 5.9 |
Inflation in Ifugao increased to 5.9 percent in June 2024 from 5.7 percent in May 2024. In addition, June 2024 inflation was higher by 2.7 percentage points from 3.2 percent in June 2023 and 0.2 percentage points lower from 5.7 percent in May 2024. (Table 1)
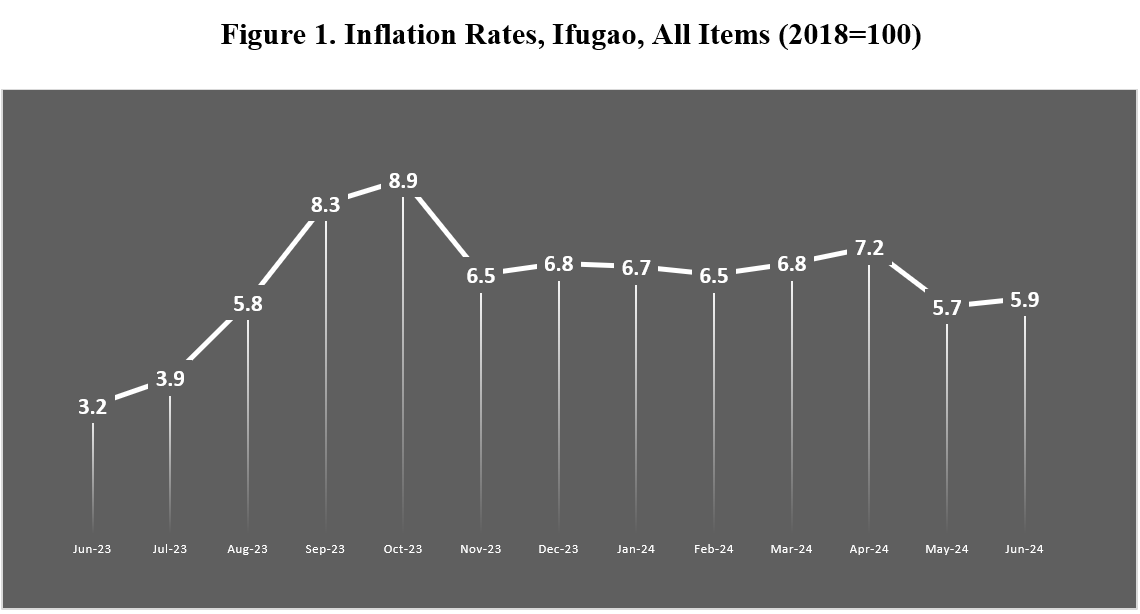
Figure 2. Year-on-Year Inflation Rates by Commodity Group: Ifugao (2018 = 100)
(In Percent)
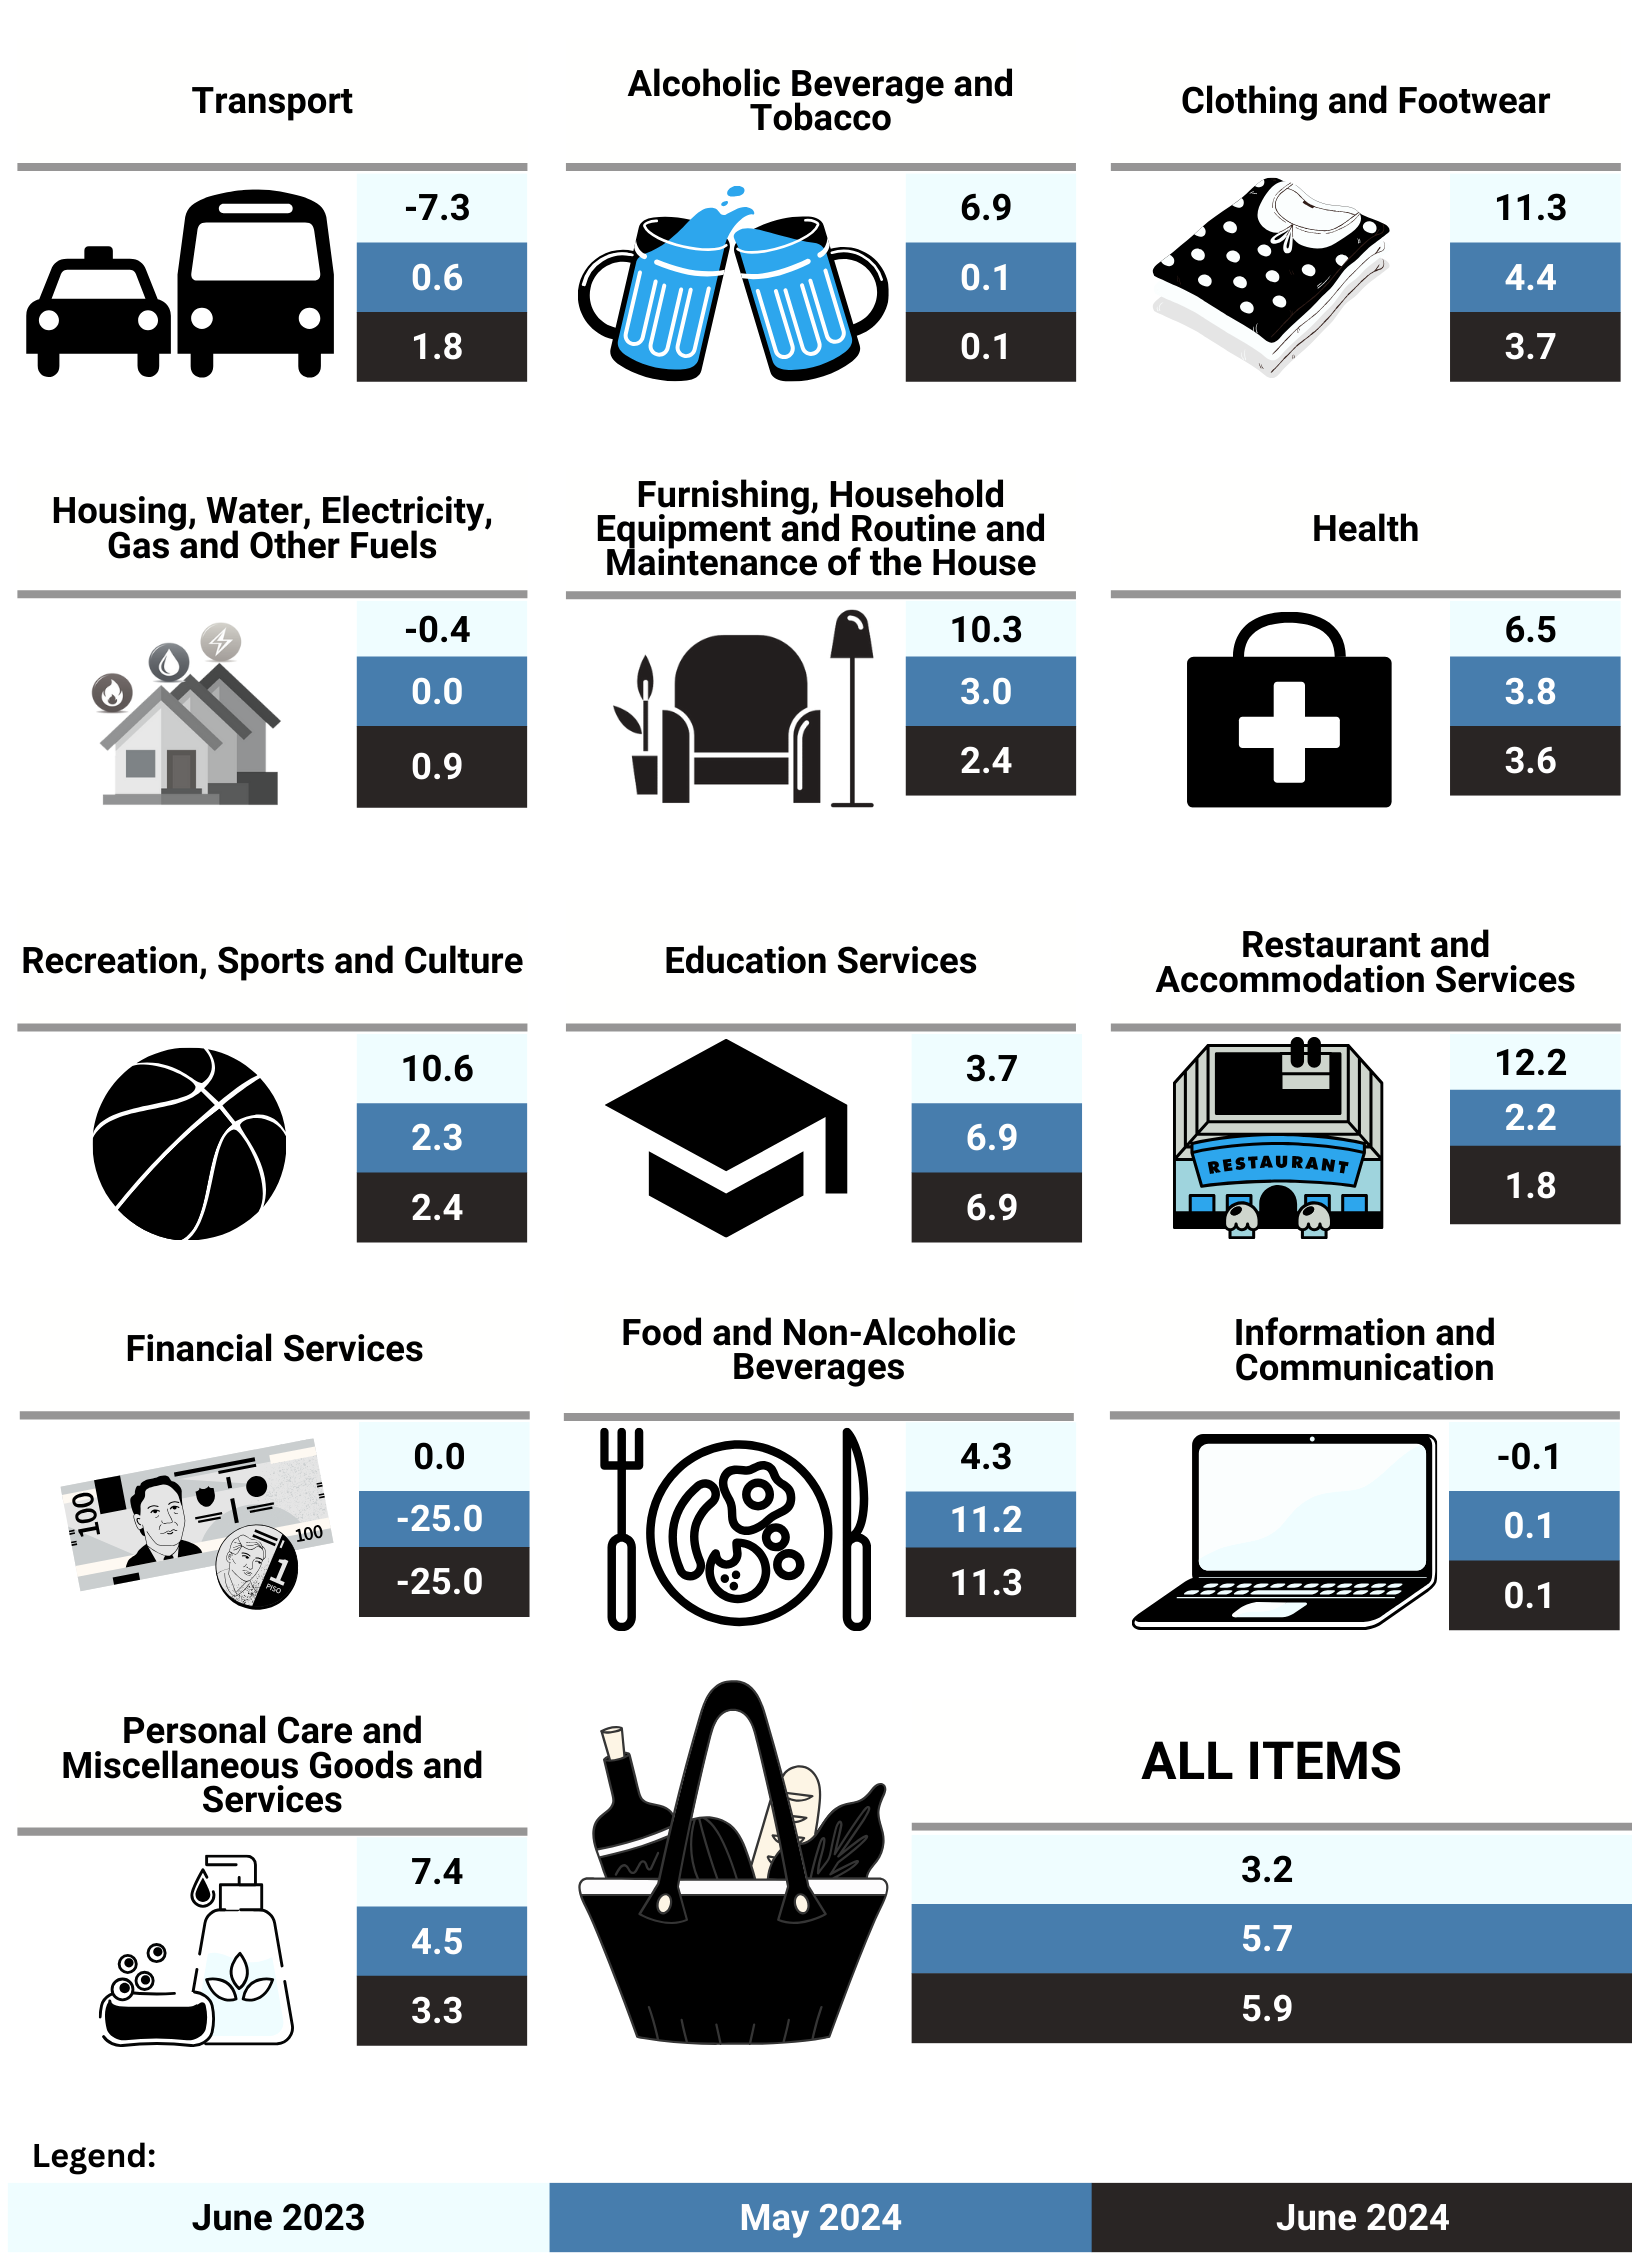
In terms of inflation rates among commodity groups, Food and Non-Alcoholic Beverages experienced the highest increase at 11.3 percent. Following closely behind, Education Services recorded a 6.9 percent inflation rate and Clothing and Footwear with 3.7 percent.
In addition, contributing to the uptrend in the overall inflation during the period were the higher annual average growth in the indices of the following commodity groups:
Health, 3.6
Personal Care, and Miscellaneous Goods and Services, 3.3
Furnishings, Household Equipment and Routine Household Maintenance, 2.4
Recreation, Sport and Culture, 2.4
Transport, 1.8
Restaurants and Accommodation Services, 1.8
Housing, Water, Electricity, Gas and Other Fuels, 0.9
Alcoholic Beverages and Tobacco, 0.1
Information and Communication, 0.1
'Table 2. Consumer Price Index by Subgroup, Month-on-Month and Year-on-Year Percent Changes
Commodity Group | CPI | |||
Jun 2023 | May 2024 | Jun 2024 | ||
ALL ITEMS | 120.0 | 127.1 | 127.1 | |
I. FOOD AND NON-ALCOHOLIC BEVERAGES | 114.8 | 127.2 | 127.8 | |
* Food | 114.5 | 127.4 | 128.0 | |
Cereals and Cereal Products | 93.5 | 119.4 | 119.6 | |
| 88.4 | 118.5 | 118.7 | |
| 87.6 | 118.3 | 118.5 | |
| 124.9 | 125.7 | 125.7 | |
| 124.0 | 125.3 | 125.3 | |
| 138.7 | 143.2 | 143.2 | |
| 128.0 | 134.0 | 133.0 | |
| 128.5 | 133.4 | 133.4 | |
| 96.8 | 97.2 | 97.2 | |
| 113.9 | 117.1 | 108.3 | |
| 130.7 | 133.1 | 141.4 | |
| 144.5 | 134.9 | 134.9 | |
| 118.9 | 123.7 | 125.0 | |
| 122.5 | 123.7 | 123.7 | |
|
|
|
| |
II. ALCOHOLIC BEVERAGES AND TOBACCO | 135.5 | 135.5 | 135.7 | |
| 127.0 | 126.2 | 126.5 | |
| 161.1 | 163.3 | 163.3 | |
|
|
|
| |
|
|
|
| |
NON-FOOD | 123.5 | 126.5 | 126.1 | |
|
|
|
| |
III. CLOTHING AND FOOTWEAR | 135.4 | 140.2 | 140.4 | |
| 135.5 | 140.2 | 140.5 | |
| 135.2 | 140.3 | 140.3 | |
|
|
|
| |
IV. HOUSING, WATER, ELECTRICITY, GAS AND OTHER FUELS | 120.0 | 121.8 | 121.1 | |
| 115.2 | 115.2 | 115.2 | |
| 128.2 | 131.1 | 131.1 | |
| 113.6 | 113.6 | 113.6 | |
| 124.9 | 128.8 | 127.3 | |
|
|
|
| |
V. FURNISHINGS, HOUSEHOLD EQUIPMENT AND ROUTINE HOUSEHOLD MAINTENANCE | 122.2 | 125.1 | 125.1 | |
| 104.9 | 105.4 | 105.4 | |
| 120.3 | 121.8 | 121.7 | |
| 113.5 | 116.2 | 116.2 | |
| 113.6 | 121.0 | 121.6 | |
| 112.5 | 112.5 | 112.6 | |
| 130.1 | 133.7 | 133.7 | |
|
|
|
| |
VI. HEALTH | 126.5 | 131.1 | 131.1 | |
| 126.9 | 130.9 | 131.0 | |
| 121.9 | 121.9 | 121.9 | |
| 132.8 | 144.3 | 144.3 | |
| 103.0 | 105.8 | 105.8 | |
|
|
|
| |
VII. TRANSPORT | 125.0 | 128.4 | 127.3 | |
|
|
|
| |
| 118.5 | 124.7 | 122.6 | |
| 133.1 | 133.1 | 133.1 | |
|
|
|
| |
|
|
|
| |
VIII. INFORMATION AND COMMUNICATION | 99.9 | 100.0 | 100.0 | |
| 100.2 | 100.2 | 100.2 | |
| 99.7 | 99.8 | 99.8 | |
|
|
|
| |
IX. RECREATION, SPORT AND CULTURE | 127.4 | 130.5 | 130.5 | |
|
|
|
| |
| 104.1 | 105.5 | 105.5 | |
| 112.2 | 106.1 | 105.9 | |
| 101.1 | 101.1 | 101.1 | |
|
|
|
| |
| 100.2 | 100.2 | 100.2 | |
| 134.0 | 138.5 | 138.5 | |
|
|
|
| |
|
|
|
| |
X. EDUCATION SERVICES | 111.1 | 118.8 | 118.8 | |
| 126.2 | 128.3 | 128.3 | |
| 120.3 | 137.9 | 137.9 | |
| 100.0 | 100.0 | 100.0 | |
|
|
|
| |
|
|
|
| |
XI. RESTAURANTS AND ACCOMMODATION SERVICES | 148.5 | 151.2 | 151.2 | |
| 148.5 | 151.2 | 151.2 | |
|
|
|
| |
|
|
|
| |
XII. FINANCIAL SERVICES | 100.0 | 75.0 | 75.0 | |
| 100.0 | 75.0 | 75.0 | |
|
|
|
| |
XIII. PERSONAL CARE, AND MISCELLANEOUS GOODS AND SERVICES | 118.0 | 121.9 | 121.9 | |
| 122.2 | 125.2 | 125.2 | |
| 104.4 | 111.5 | 111.5 | |
| 100.4 | 100.4 | 100.4 | |
|
|
|
| |
The Survey of Retail Prices of Commodities, conducted by the Philippine Statistics Authority (PSA), has produced a Consumer Price Index (CPI) of 127.1 in Ifugao as of June 2024, with 2018 serving as the base year. This figure indicates that the overall cost of a typical basket of goods and services commonly purchased by a Filipino household in various municipalities of Ifugao remained stable during the reference month.
Table 2 illustrates that all commodity groups either maintained their Consumer Price Index or experienced a decrease, except for Food and Non-Alcoholic Beverages, Clothing and Footwear, Alcoholic Beverages and Tobacco, Furnishings, Household Equipment and Routine Household Maintenance, Health, Information and Communication, Recreation, Sport and Culture, Education Services, Restaurants and Accommodation Services, Financial Services, Personal Care, and Miscellaneous Goods and Services, Housing, Water, Electricity, Gas and Other Fuels Transport
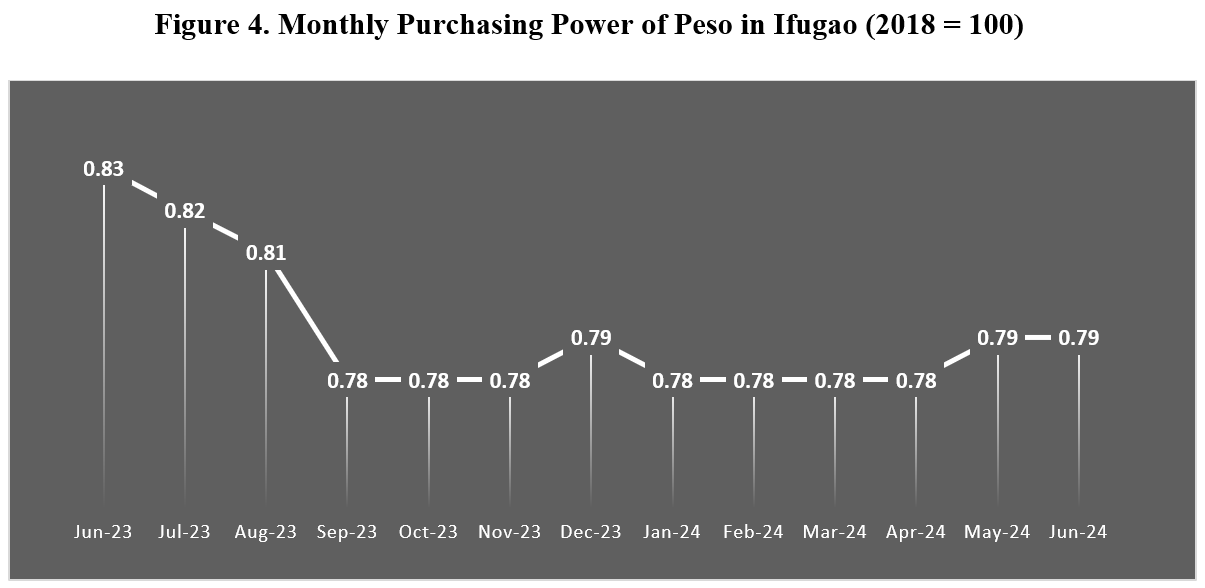
The Purchasing Power of the Peso (PPP) is intricately tied to the Inflation Rate, albeit in an inverse manner. As the Inflation Rate rises, the PPP declines. To illustrate, consider 1 peso in 2018: in June 2024, its value dwindles to 79 centavos, marking a decrease of 4 centavos from June 2023 when it stood at 83 centavos. Similarly, a hundred pesos from 2018 would translate to just 79 pesos by June 2024.
This consistent drop in the purchasing power of peso underscores the profound impact of inflation on consumers. With the diminishing purchasing power of the peso, maintaining the usual standard of living and managing expenses becomes increasingly challenging.
A decline in the purchasing power of the peso implies that each peso can procure fewer goods and services than before.
TECHNICAL NOTES
Consumer Price Index (CPI)
The CPI is an indicator of the changes in the average retail prices of a fixed basket of goods and services that most people buy for their day-to-day consumption relative to a base year.
Uses of CPI
The CPI is most widely used to calculate inflation rate and the purchasing power of peso. It is a major statistical series used for economic analysis and as monitoring indicator of government economic policy. It is also used to adjust other economic series for price changes. For example, CPI components are used as deflators for most personal consumption expenditures (PCE) in the calculation in the Gross National Product (GNP). Another major importance of the CPI is its use as basis to adjust wages in labor management contracts as well as pensions and retirement benefits. Increases in wages through collective bargaining agreements used the CPI as one of their bases.
Computation of the CPI
The computation of the CPI involves consideration of the following important points:
Base Period.
The reference date or period is the benchmark or reference date or period at which the index is taken as equal to 100
Market Basket
A sample of the thousands of varieties of goods purchased for consumption and services availed by the households in the country was selected to represent the composite price behavior of all goods and services purchased by consumers.
Weighting System
The weighting pattern uses the expenditures on various consumer item purchased by households as proportion to total expenditure.
Formula
The formula used in computing the CPI is the weighted arithmetic mean of price relatives, the Laspeyre’s formula with a fixed base year period (2012) weights.
Geographic Coverage
CPI values are computed at the national, regional, and provincial levels, and for selected cities.
Inflation Rate (IR)
The Inflation Rate is the rate of change or the year-on-year change of the CPI. Inflation is interpreted in terms of declining purchasing power of peso.
Headline Inflation
Headline inflation refers to the rate of change in CPI. It captures the changes in the cost of living based on the movements of prices of items in the basket of commodities and services consumed by the typical Filipino households.
Core Inflation
Core inflation measures the change in average consumer prices after excluding from the CPI certain items with volatile price movements. By stripping out the volatile components of the CPI, core inflation allows us to see the broad underlying trend in consumer prices. Core inflation is often used as an indicator of the long-term inflation trend and as indicator of future inflation. It is usually affected by the amount of money in the economy relative to production, or by monetary policy.
Purchasing Power of the Peso (PPP)
The purchasing power of the peso (PPP) shows how much peso in the base period is worth in the current period. It is computed as the reciprocal of the CPI for the period under review multiplied by 100.
DELANO C. BOLISLIS, JR.
Chief Statistical Specialist
/CMC
| Attachment | Size |
|---|---|
|
|
946.18 KB |