Release Date :
Reference Number :
SR–2021–17
The Fishery production in Ifugao, as of the 2021 Second Quarter increased by 34.0 percent compared to its total production in the same period a year ago. The increased attributed to the coming of rainy season bringing more rain which is essential in fishpond operation. The acquisition of quality tilapia fingerlings jack up the production during the stocking and rearing particularly on Freshwater cage and Freshwater fishpond production.
The produced uptick to 572.48 metric tons from 377.61 metric tons, gaining over 194.87 metric tons to its 2020 Second Quarter total production.
Ifugao Fishery production uptick by 34.0 percent
The province of Ifugao still ranked number one in Fishery production among the six provinces in the Cordillera Administrative Region (CAR) as of the 2nd quarter of 2021. Ifugao accounted for 61.0 percent share or 572.48 metric tons to the region’s total production of 938.87 metric tons.
As shown in table 1, the production went up to 572.48 metric tons in the 2nd quarter of 2021 from 377.61 metric tons in the same period a year ago, showing 34.0 percent rate increased. The coming of the rainy season which was needed in the fishpond operation and easing of Covid-19 protocols allowed the fishpond operators to look outside the province of a quality tilapia fingerlings for the stocking and rearing which was contributed big in the increased of production, thus resulted into a positive growth production in the province.
Table No. 1. Quarterly Fishery Production by Sub-sectors,
Ifugao, 2nd Quarter, 2021 – 2020
| Sub-sector | Production (metric tons) | %Change | |
| Q2 2021 | Q2 2020 | ||
| Total Fishery Produced | 572.48 | 377.61 | 34.0 |
| Municipal | 16.96 | 38.01 | (55.4) |
| Inland | 16.96 | 38.01 | (55.4) |
| Aquaculture | 555.52 | 339.60 | 38.9 |
| Freshwater Fishpond | 259.29 | 170.50 | 34.2 |
| Freshwater cage | 296.23 | 169.10 | 42.9 |
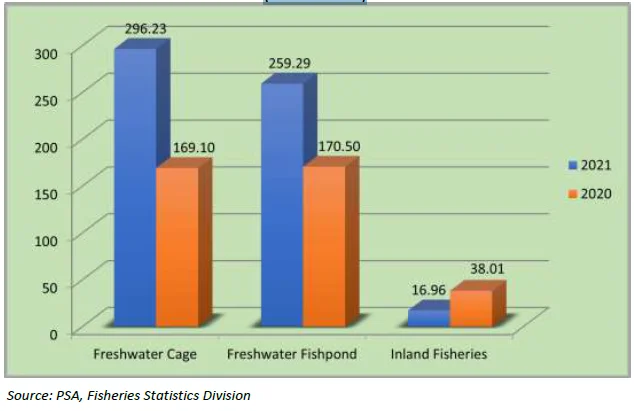
Figure 1, illustrates the disaggregated variables or culture type comprising aquaculture sub-sector wherein Freshwater cage increased by 42.9 percent from 169.10
metric tons in the 2nd quarter of 2020 to 296.23 metric tons in the 2nd quarter of 2021. Likewise, Freshwater fishpond also increased by 34.2 percent from 170.50 metric tons in the 2nd quarter of 2020 to 259.29 metric tons in the 2nd quarter of 2021.
Figure 1, Quarterly Fishery Production by Sub-sectors,
Ifugao, 2nd Quarter, 2021-2020
(In metric tons)

Meanwhile, Municipal Inland fishery sector decreased by 55.4 percent from 38.01 metric tons in the 2nd quarter of 2020 to 16.96 metric tons in the 2nd quarter of 2021. The limited fishing mandays by the respondents due to Covid-19 pandemic restrictions contributed a large downtrend in their catch and scarcity of fish catch in the rivers or waterways due to poor breeding ground resulted to low production in the province.
Table 2. Inland Municipal Fisheries and Aquaculture, Volume of Production by
Geo-location, CAR, 2nd Quarter, 2021 – 2020 (In metric tons)
| Region/Province | Year | ||
| Type/Environment/Species | Q2 2021 | Q2 2020 | |
| Cordillera Administrative Region | Inland Municipal Fisheries | 93.43 | 195.23 |
| Abra | 52.43 | 68.14 | |
| Apayao | 1.22 | 22.8 | |
| Benguet | 1.41 | 6.39 | |
| Ifugao | 16.96 | 38.01 | |
| Kalinga | 18.33 | 58.43 | |
| Mountain Province | 3.08 | 1.98 | |
| Cordillera Administrative Region | Freshwater Fishpond | 542.31 | 442.86 |
| Abra | 123.66 | 120.67 | |
| Apayao | 10.17 | 21.31 | |
| Benguet | 4.71 | 2.92 | |
| Ifugao | 259.29 | 170.50 | |
| Kalinga | 140.29 | 124.45 | |
| Mountain Province | 4.19 | 3.01 | |
| Cordillera Administrative Region | Freshwater Cage | 303.13 | 213.84 |
| Abra | 0.12 | 0.10 | |
| Apayao | 0.02 | 0.09 | |
| Benguet | 6.49 | 44.12 | |
| Ifugao | 296.23 | 169.10 | |
| Kalinga | 0.0 | 0.0 | |
| Mountain Province | 0.27 | 0.43 | |
Ifugao produce 61 percent of CAR’s total Fishery production
The province of Ifugao ranked number one in Fishery production in CAR as of the 2nd quarter of 2021 sharing 61.0 percent to the region’s total production. As shown in table 2, the province is ranked number three (3) in Tilapia production under the Inland Municipal Fishery sector sharing 18.1 percent or 16.96 metric tons to the region’s total production. However, Ifugao ranked number one in Tilapia production under Freshwater Fishpond and Freshwater Cage sharing 47.8 percent and 97.7 percent to the region’s total production, respectively.
Table 3. Top Four Species in Inland Municipal Fishery Production,
Ifugao, 2nd Quarter, 2021 - 2020 (In metric tons)
| Name of Species | Year | |
| Q2 2021 | Q2 2020 | |
| Tilapia | 8.45 | 15.33 |
| Carp | 1.91 | 4.14 |
| Freshwater Goby (Biya) | 1.38 | 4.87 |
| Silver Perch (Ayunin) | 2.31 | 4.40 |
Tilapia top the production in Inland Municipal Fishery
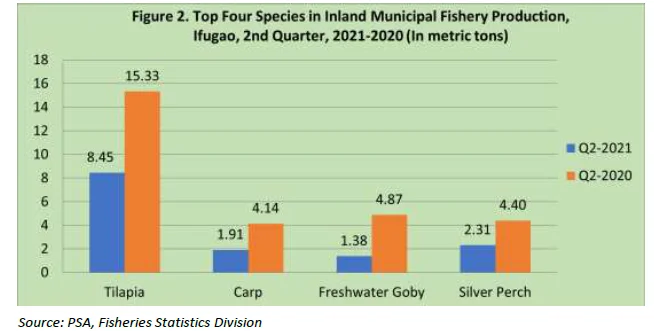
As we looked further in table 3, the top four produced species in the province for the 2nd quarter of 2021 showed a production of 8.45 metric tons of Tilapia from 15.33 metric tons in the 2nd quarter 2020, posted a decrease of 44.9 percent; a production of 1.91 metric tons of Carp from 4.14 metric tons in 2020, posted a decrease of 53.9 percent; a production of 1.38 metric tons of Freshwater Goby from 4.87 metric tons in 2020, posted a decrease of 71.7 percent; a production of 2.31 metric tons of Silver Perch from 4.40 metric tons in 2020, posted a decrease of 47.5 percent.

Of the top four produced species in the province, Tilapia top the production with 8.45 metric tons in the 2nd quarter of 2021, followed by Silver Perch with a production of 2.31 metric tons and Carp with 1.91 metric tons. On the other hand, Freshwater Goby yielded the least production of only 1.38 metric tons.

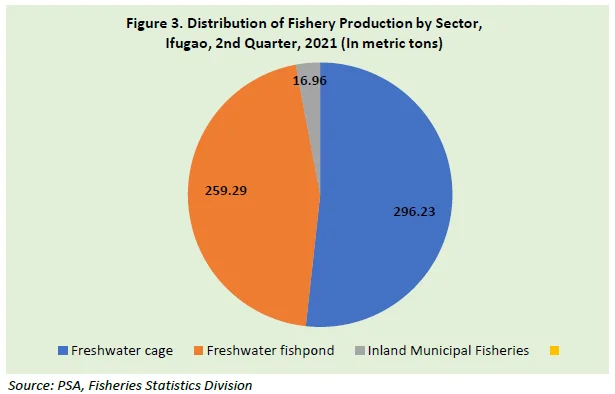
Fishery production in Ifugao for the 2nd quarter of 2021 was estimated to 572.48 metric tons. As for the distribution of its production by sub- sector, we can assumed that Freshwater Cage contributed significantly with almost 52.0 percent share or 296.23 metric tons, trailed behind is the Freshwater Fishpond with 45.0 percent share or 259.29 metric tons. Meantime, Inland Municipal Fishery got the least contribution with a total haul of nearly 3.0 percent share or 16.96 metric tons to the provincial total production, as shown in figure 3.

