| Sub-Sector | Production (Metric Tons) | %Change | |
| Q4 2020 | Q4-2019 | ||
| Total Fishery Produced | 611.87 | 764.83 | (20.00) |
| Municipal | 21.08 | 46.50 | (54.67) |
| Inland | 21.08 | 46.50 | (54.67) |
| Aquaculture | 590.79 | 718.33 | (17.75) |
| Freshwater Fishpond | 162.63 | 307.55 | (47.2) |
| Freshwater Cage | 428.16 | 410.78 | 4.06 |
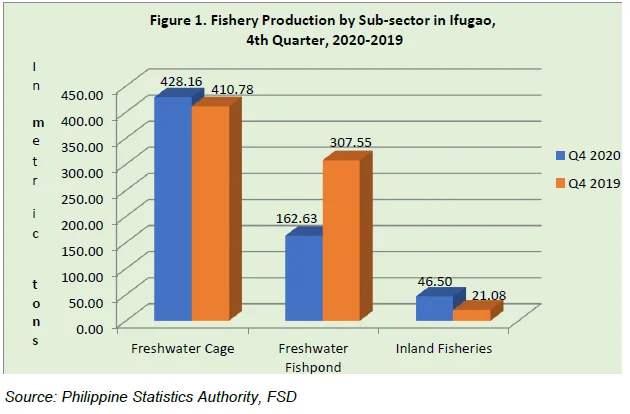
Figure 1, illustrates the disaggregated variables or culture type comprising aquaculture sub-sector wherein Freshwater cage increased by 4.06 percent from 410.78 metric tons in 2019 fourth quarter to 428.16 metric tons in 2020 fourth quarter. However, Freshwater fishpond decreased by 47.12 percent from 307.55 metric tons in 2019 fourth quarter to 162.63 metric tons in 2020 fourth quarter.

On the Inland municipal fishery sector, it decreased by 54.67 percent from 46.50 metric tons in 2019 fourth quarter to 21.08 metric tons in 2020 fourth quarter. The limited fishing mandays by the respondents and scarcity of fish catch in the rivers or waterways resulted to low production in the province.
| Name of Species | Year | |
| Q4-202 | Q4-2019 | |
| Tilapia | 10.10 | 22.58 |
| Carp | 3.11 | 4.40 |
| Freshwater Goby (Biya) | 2.28 | 4.30 |
| Silver Perch (Ayungin) | 2.90 | 7.30 |
| Mudfish (Dalag) | 0.0 | 0.0 |
Tilapia top the production in Inland Municipal Fishery
As we looked further in table 2, the top five species produced in the province for the fourth quarter of 2020 showed a production of 10.10 metric tons of tilapia from 22.58 metric tons in 2019 fourth quarter, posted a decrease of 55.27 percent; a production of 3.11 metric tons of carp from 4.40 metric tons in 2019, posted a decrease of 29.32 percent; a production of 2.28 metric tons of freshwater goby from 4.30 metric tons in 2019, posted a decrease of 46.98 percent; a production of 2.90 metric tons of silver perch from 7.30 metric tons in 2019, posted a decrease of 60.27 percent and a negative production of mudfish in 2020 and 2019 fourth quarter.
| Region/Province | Year | ||
| Type/Environment/Species | Q4-2020 | Q4-2019 | |
| Cordillera Administrative Region | Inland Municipal Fisheries | 253.79 | 296.82 |
| Abra | Inland Municipal Fisheries | 87.91 | 77.95 |
| Apayao | Inland Municipal Fisheries | 25.67 | 65.94 |
| Benguet | Inland Municipal Fisheries | 16.22 | 13.11 |
| Ifugao | Inland Municipal Fisheries | 21.08 | 46.50 |
| Kalinga | Inland Municipal Fisheries | 101.25 | 92.00 |
| Mt. Province | Inland Municipal Fisheries | 1.66 | 1.32 |
| Region/Province | Year | ||
| Type/Environment/Species | Q4-2020 | Q4-2019 | |
| Cordillera Administrative Region | Freshwater fishpond | 321.68 | 448.95 |
| Abra | Freshwater fishpond | 99.04 | 90.20 |
| Apayao | Freshwater fishpond | 14.21 | 9.42 |
| Benguet | Freshwater fishpond | 11.61 | 11.85 |
| Ifugao | Freshwater fishpond | 162.63 | 307.55 |
| Kalinga | Freshwater fishpond | 30.44 | 27.12 |
| Mt. Province | Freshwater fishpond | 3.75 | 2.81 |
| Abra | Freshwater Cage | 0.04 | 0.0 |
| Apayao | Freshwater Cage | 0.06 | 0.85 |
| Benguet | Freshwater Cage | 46.64 | 48.24 |
| Ifugao | Freshwater Cage | 428.16 | 410.78 |
| Kalinga | Freshwater Cage | 0.0 | 0.0 |
| Mt. Province | Freshwater Cage | 0.0 | 0.39 |

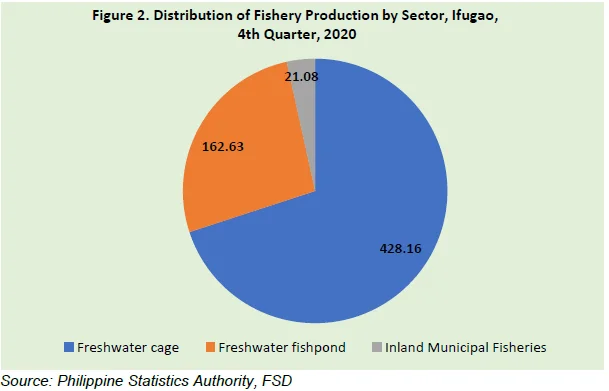
As shown in figure 2, Fishery production in Ifugao for the 2020 fourth quarter was estimated to 611.87 metric tons. As for the distribution of its production by sub- sector, we can assumed that Freshwater cage contributed the bigger haul with almost 70.0 percent share or 428.16 metric tons, tailed behind is the Freshwater fishpond with 26.58 percent share or 162.63 metric tons. Meanwhile, Inland municipal fishery got the smaller contribution of the total haul with only 3.45 percent share or 21.08 metric tons to the whole production of the province.

