Release Date :
Reference Number :
SR-2020-016

Ifugao CPI at 121.0 in September 2020

Survey of Retail Prices of Commodities conducted by Philippine Statistics Authority (PSA) has generated a Consumer Price Index (CPI) of 121.0 for Ifugao as of September 2020, using 2012 as the base year. This indicates that the average cost of a basket of goods and services commonly purchased by a typical Filipino household in the different municipalities of Ifugao increased during the reference month. This is 0.30 index points compared in August 2020 with CPI = 120.7 and 3.50 index points higher a year ago.

Table 1. Monthly Consumer Price Index for All Income Households by Commodity Group,
Ifugao: September 2020 - August 2020 (2012 = 100)
Commodity Group September 2020 September 2019 August 2019 August 2018
All Items 121.0 117.5 120.7 117.7

        Food and Non - Alcoholic
         Beverages

117.7 114.3 117.4 114.7

        Alcoholic Beverages and
        Tobaco

253.3 216.4 249.2 216.4
        Clothing and Footwear 133.8 128.0 133.7 128.0

         Housing, Water, Electricity,
         Gas and Other Fuels

126.0 124.2 126.1 124.3
          Furnishing, Household
          Equipment and Routine
          Maintainance of the House
115.1 113.0 115.1 113.0
         Health  133.9 128.3 133.3 127.5
         Transport 104.4 105.0 104.0 105.1
         Communication 101.4 101.0 101.4 101.0
         Recreation and Culture 109.8 108.0 109.6 107.7
         Education 108.7 107.1 107.1 107.1
         Restaurants and
          Miscellaneous Goods
          and Services
119.2 115.8 119.1 115.8
                  Source: Philippine Statistics Authority
 
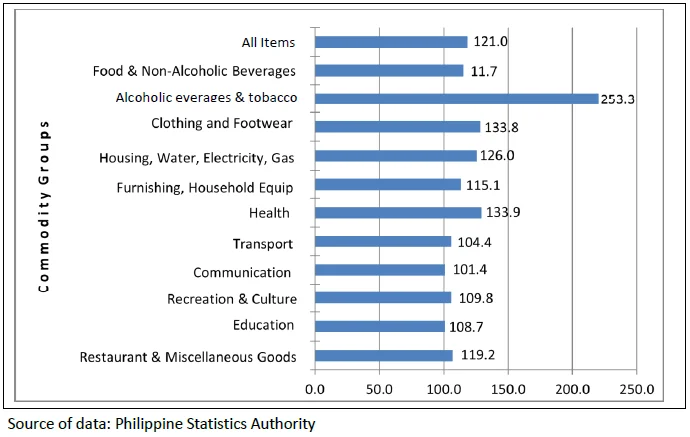
Figure 1 shows that commodity under the groups of the Alcoholic beverages and tobacco, Health, Clothing & footwear, and Housing, water, electricity, gas and other fuel had the highest corresponding CPI’s of 253.3, 133.9, 133.8 and 126.0 in September 2020, respectively. These four commodity groups have CPI’s higher than the total average CPI of all items in the province.
 
On the other hand, Education and Communication with CPI’s 108.7 and 101.4, respectively, had no significant changes across the months. These mean that price of Communication did not moved from the past month and cost of Education in the province slightly increased from the base year.
 
Figure 1. Consumer Price Index for All Income Households in
Ifugao: September 2020 (2012=100)
 
 
Inflation Rate
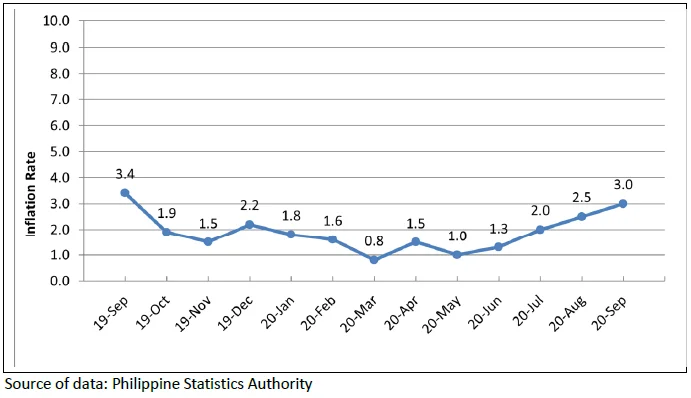
The average headline Inflation Rate (IR) in Ifugao deccelarated to 3.0 percent as of September 2020 as compared to the same period in the previous year. This was realized because of the stability of goods and services commonly purchased by the filipino households in the province for the past months.
 
As shown in Figure 2, the trend has been decreasing and the result for September 2020 posted 0.5 index points increased from the previous month.
 
Figure 2. Year-on-Year Headline Inflation Rate, All Items by Commodity Group, Ifugao,
September 2019 - September 2020 (2012 = 100)
 

As shown in Table 2, Alcoholic beverages and tobacco (1.6 percent) was the commodity group that posted the higher growth rates in September 2020. On the other hand, Alcoholic beverages and tobacco had the most rapidly changing average price between the month of September 2020 and August 2020 with an increased of 1.6 percentage points.

Table 2. Month-on- Month Headline Inflation Rate, All items by Commodity Group,
Ifugao: September 2020 - August 2020 (2012=100)
Commodity Group September 2020 August 2020
All Items 0.2 -0.2

        Food and Non - Alcoholic
         Beverages

0.3 -0.3

        Alcoholic Beverages and
        Tobaco

1.6 0.0
        Clothing and Footwear 0.1 0.0

         Housing, Water, Electricity,
         Gas and Other Fuels

-0.1 -0.1
          Furnishing, Household
          Equipment and Routine
          Maintainance of the House
0.0 0.0
         Health  0.4 0.6
         Transport 0.4 -0.1
         Communication 0.0 0.0
         Recreation and Culture 0.2 0.3
         Education 1.5 0.0
         Restaurants and
          Miscellaneous Goods
          and Services
0.0 0.0
                  Source: Philippine Statistics Authority
 
As shown in table 3, Cordillera Administrative Region generated a Consumer Price Index of 121.2 as of July 2020 for all income households in the region. Kalinga recorded the highest CPI for all items commonly purchased by a household in CAR with 126.6, trailed behind is Apayao (123.5) and Benguet (121.3) while Mountain Province had the least among the six provinces in the region with 118.4 index points.
 
Table 3. Monthly Consumer Price Index for All Income Households by Commodity Group,
CAR: September - 2020 (2012 = 100)
 
Commodity Group CAR Abra Apayao Benguet Ifugao Kalinga Mt. Province
All Items 121.3 120.0 121.1 121.0 126.5 119.3 123.6

        Food and Non - Alcoholic
         Beverages

121.8 118.4 120.8 117.7 127.0 119.7 119.1

        Alcoholic Beverages and
        Tobaco

245.8 341.2 202.3 253.3 313.1 210.5 422.3
        Clothing and Footwear 129.2 123.9 128.7 133.8 138.3 129.1 124.2

         Housing, Water, Electricity,
         Gas and Other Fuels

119.0 110.0 121.0 126.0 105.6 118.3 120.1
          Furnishing, Household
          Equipment and Routine
          Maintainance of the House
116.5 116.5 113.5 115.1 139.6 120.6 122.6
         Health  124.0 113.4 128.6 133.9 130.5 104.0 115.6
         Transport 104.6 108.2 104.4 104.4 99.6 107.2 101.3
         Communication 102.2 105.0 101.7 101.4 104.8 98.0 104.9
         Recreation and Culture 109.9 115.6 105.0 109.8 126.0 107.5 135.0
         Education 128.9 108.0 128.5 108.7 193.9 129.4 75.5
         Restaurants and
          Miscellaneous Goods
          and Services
123.6 125.3 118.9 119.2 130.2 140.4 133.4
                  Source: Philippine Statistics Authority
 
 
Purchasing Power of Peso
 
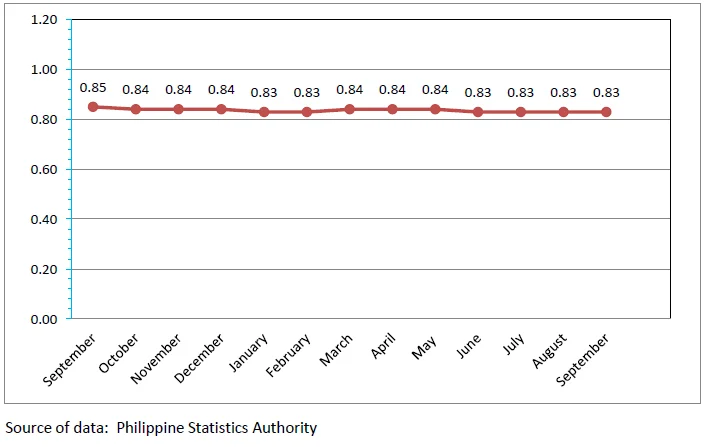
Purchasing Power of the Peso (PPP) is inversely related to inflation rate. Thus, as the inflation rate increases, PPP declines. The average PPP in Ifugao in 2019 is at 0.85. This implies that Php 1.00 in 2012, as the base year, values only Php 0.85 in 2019.
 
As a result of the price changes reflected in the CPI, the provincial Purchasing Power of the Peso remained at 0.83 as shown in figure 3.
 
 
Figure 3. Monthly Purchasing Power of Peso in Ifugao:
September 2019 – September 2020 (2012=100)
 
Tags

November 2024 Price Situation in Ifugao for All Income Household (Base Year:2018)

Inflation in Ifugao decreased to 1.4 percent in November 2024 from 0.4 percent in October 2024. In addition, November 2024 inflation was lower by 7.9 percentage points from 6.5 percent in November…

2023 Economic Performance of Ifugao

The economy of Ifugao contracted by 4.1 percent in 2023 from a 6.7 percent growth in the previous year. The Gross Domestic Product (GDP) of Ifugao was estimated at PhP 26.83 billion. (Figure 1)

October 2024 Price Situation in Ifugao (Base Year: 2018)

Inflation in Ifugao increased to 0.4 percent in October 2024 from -1.1 percent in September 2024. In addition, October 2024 inflation was lower by 8.5 percentage points from 8.9 percent in October…