Release Date :
Reference Number :
SR–2021–009
Survey of Retail Prices of Commodities conducted by Philippine Statistics Authority (PSA) has generated a Consumer Price Index (CPI) of 126.2 in Ifugao as of March 2021, using 2012 as the base year. This indicates that the average cost of a basket of goods and services commonly purchased by a typical Filipino household in the different municipalities of Ifugao increased during the reference month. This is -0.3 index points compared in February 2021 with CPI=126.5 and 7.0 index points higher a year ago.
Table 1. Monthly Consumer Price Index for All Income Households by Commodity Group,
Ifugao: February 2021 (2012 = 100)
| Commodity Group | March 2021 | March 2020 | February 2021 | February 2020 |
|---|---|---|---|---|
| All Items | 126.2 | 119.2 | 126.5 | 119.8 |
|
Food and Non - Alcoholic |
125.0 | 114.5 | 126.5 | 115.8 |
|
Alcoholic Beverages and |
265.3 | 241.8 | 263.4 | 237.2 |
| Clothing and Footwear | 135.8 | 133.0 | 135.4 | 130.9 |
|
Housing, Water, Electricity, |
128.6 | 127.6 | 129.8 | 128.2 |
| Furnishing, Household Equipment and Routine Maintainance of the House |
117.0 | 114.9 | 116.5 | 114.9 |
| Health | 135.1 | 131.9 | 135.0 | 131.4 |
| Transport | 106.9 | 104.3 | 104.8 | 105.3 |
| Communication | 101.4 | 101.5 | 101.4 | 101.5 |
| Recreation and Culture | 110.3 | 110.0 | 110.2 | 109.7 |
| Education | 108.7 | 107.1 | 108.7 | 107.1 |
| Restaurants and Miscellaneous Goods and Services |
124.5 | 119.1 | 121.4 | 119.0 |
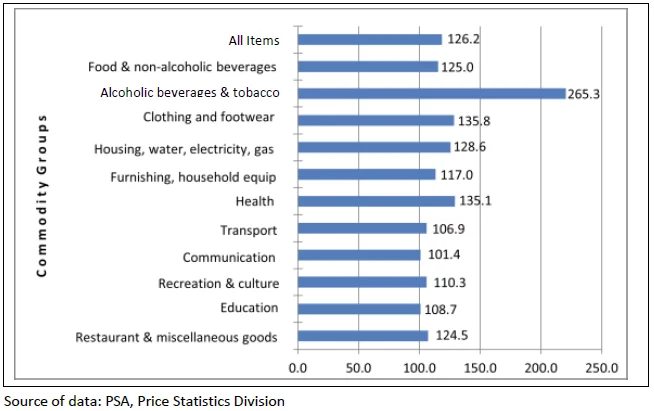
Figure 1, shows that commodity under the groups of the Alcoholic beverages and tobacco, Clothing & footwear, Health, and Housing, water, electricity, gas and other fuel had the highest corresponding CPI’s of 265.3, 135.8, 135.1, and 128.6 in March 2021, respectively. These four commodity groups have CPI’s higher than the total average CPI of all items in the province.
On the other hand, Education and Communication with CPI’s 108.7 and 101.4, respectively, had no significant changes across the months. These mean that price of Communication did not moved from the past month and cost of Education in the province slightly increased from the base year.
Figure 1. Consumer Price Index for All Income Households in
Ifugao: March 2021 (2012=100)

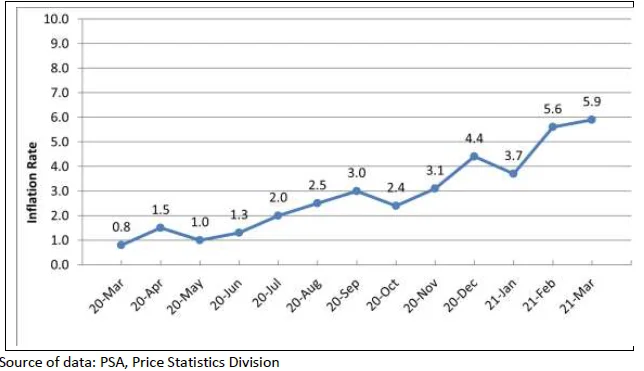
The average headline Inflation Rate (IR) in Ifugao accelarated to 5.9 percent as of March 2021 as compared to the same period in the previous year. This was realized because of the unstable prices of goods and services commonly purchased by all income households in the province for the past months.
As shown in Figure 2, the trend has been a roller coaster and it is in upward motion. The result for March 2021 posted 0.30 index points increased from the previous month and posted the highest in the last fourteen months.
Figure 2. Year-on-Year Headline Inflation Rate, All Items by Commodity Group, Ifugao,
March 2020 – March 2021 (2012 = 100)

As shown in Table 2, Restaurant and miscellaneous goods and services (2.6 percent) was the commodity group that posted the higher growth rates in March 2021. In the same way, Restaurant and miscellaneous goods and services had the most rapidly changing average price between the month of March 2021 and February 2021 with an increased of 3.1 index points.
Table 2. Month-on- Month Headline Inflation Rate, All items by Commodity Group,
Ifugao: March 2021 - February 2021 (2012=100)
| Commodity Group | March 2021 | February 2021 |
|---|---|---|
| All Items | -0.2 | -0.5 |
|
Food and Non - Alcoholic |
-1.2 | -1.1 |
|
Alcoholic Beverages and |
0.7 | 1.9 |
| Clothing and Footwear | 0.3 | 1.6 |
|
Housing, Water, Electricity, |
-0.9 | -0.1 |
| Furnishing, Household Equipment and Routine Maintainance of the House |
0.4 | 0.0 |
| Health | 0.1 | 0.4 |
| Transport | 2.0 | -0.1 |
| Communication | 0.0 | 0.0 |
| Recreation and Culture | 0.1 | 0.3 |
| Education | 0.0 | 0.0 |
| Restaurants and Miscellaneous Goods and Services |
2.6 | 0.1 |
Purchasing Power of Peso
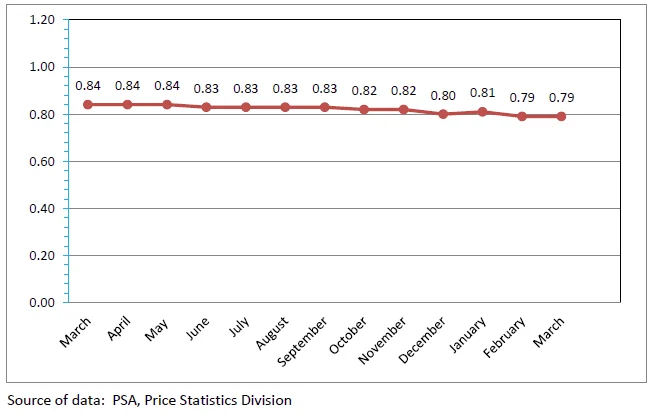
The Purchasing Power of the Peso (PPP) is inversely related to inflation rate. Thus, as the inflation rate increases, PPP declines. The average PPP in Ifugao in 2020 is at Php 0.83. This implies that Php 1.00 in 2012, as the base year, values only Php 0.83 in 2020.
As a result of the price changes of prime commodities commonly purchased by all income households in Ifugao as reflected in the CPI, the provincial Purchasing Power of the Peso plunged into a very alarming situation to Php 0.79 as shown in figure 3.
Figure 3. Monthly Purchasing Power of Peso in Ifugao:
March 2020 – March 2021 (2012=100)


