

Release Date :
Reference Number :
SSR 2025-31
The Annual Poverty Indicators Survey (APIS) is a household-based survey designed to provide information on the different indicators related to poverty that can be used to monitor the poverty situation in the country. The APIS is conducted in years when the Family Income and Expenditure Survey (FIES) is not carried out.
The 2024 APIS is the 16th in this series which has been conducted nationwide since 1998. The information collected will also be used to estimate proxy indicators for the following Sustainable Development Goals (SDGs):
a. Goal 1 – No Poverty;
b. Goal 6 – Clean Water and Sanitation; and
c. Goal 16 – Peace, Justice, and Strong Institutions.
This Special Release presents selected findings from the 2024 APIS preliminary results on drinking water, sanitation, and hygiene (WASH) service levels among Cordilleran families.
Basic drinking water services remains highly accessible to families
The 2024 Annual Poverty Indicators Survey (APIS) included questions to monitor drinking water, sanitation, and hygiene (WASH) among Filipino households. These questions support the monitoring of Sustainable Development Goals (SDGs), particularly Goal 6 – Clean Water and Sanitation.
According to the preliminary results of the 2024 APIS, more than one-third of families (37.8%) in the Cordillera Administrative Region (CAR) had access to a safely managed drinking water service from an improved source. Safely managed drinking water service is defined as water sourced from the Community Water System and piped into the family’s dwellings or yards/plots, provided that drinking water is always sufficient, and the family pays a monthly water bill charged by a Water Utility company.
Figure 1. Percentage of Families by Service Level of Drinking Water,
CAR: 2022f and 2024p
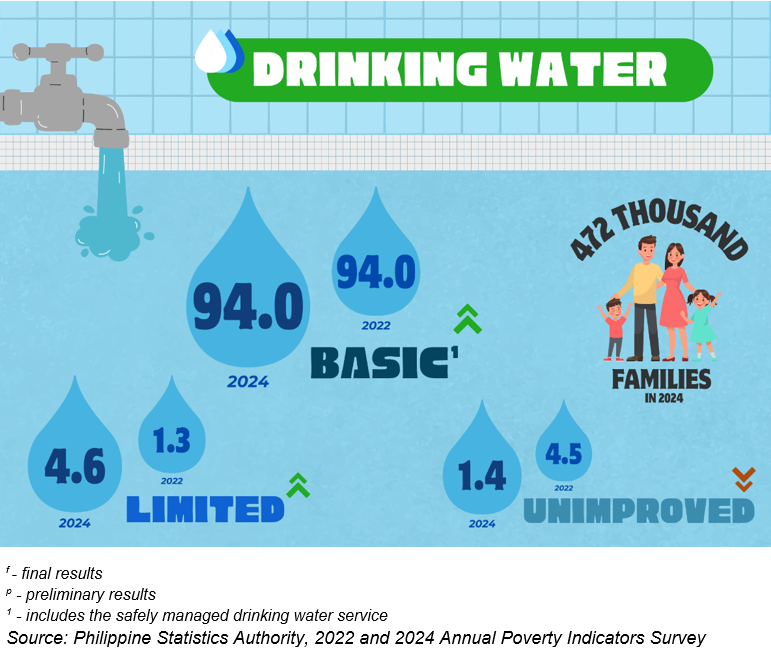
In addition, out of approximately 472 thousand families in the region, 56.2% had access to basic drinking water service from an improved source, where the collection time to and from the source is not more than 30 minutes. With this, 94.0% of families were with access to at least basic drinking water service in 2024. The same percentage was recorded in 2022. Meanwhile, access to a limited drinking water service among families increased to 4.6% in 2024 from 1.3% in 2022.
Across regions, access to a basic drinking water service among families was highest in BARMM (73.4%), followed by Cagayan Valley (70.9%), Bicol Region (68.3%), and Zamboanga Peninsula (66.6%). On the other hand, the National Capital Region recorded the least access with 14.1%. CALABARZON and Central Luzon followed with 25.5% and 32.4%, respectively. More than half of families in CAR were with access to a basic drinking water service.
Access to basic sanitation facilities improves
Basic sanitation services were more accessible to Cordilleran families from 87.4% in 2022 to 90.7% in 2024. Meanwhile, limited sanitation services were less accessed by families in 2024 with 6.3% from 8.6% over the same period. Basic sanitation services refer to improved sanitation facilities that are used exclusively by a single household while limited sanitation services are improved facilities that are shared between two or more households.
Figure 2. Percentage of Families by Service Level of Sanitation Facility,
CAR: 2022f and 2024p
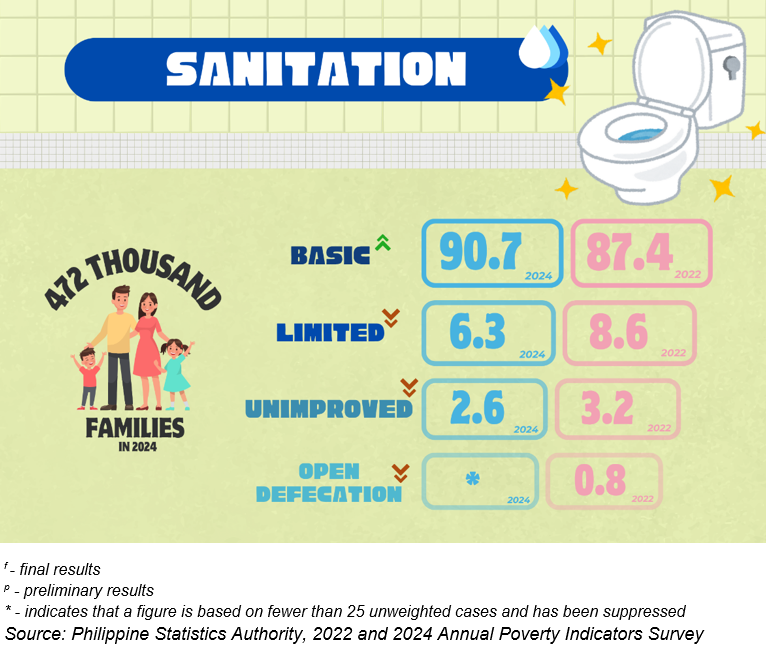
The percentage of families in CAR who either used an unimproved sanitation facility (2.6%) or practiced open defecation due to the lack of a sanitation facility declined compared to the share of families who did not have access to basic or limited sanitation facilities in 2022.
Region-wise, Central Luzon (94.3%), CAR (90.7%), and Caraga (88.3%) recorded the highest proportion of families with access to a basic sanitation service. On the other hand, BARMM had the lowest percentage with 57.1%, followed by SOCCSKSARGEN with 74.4%, and Davao Region with 80.6%.
Moreover, BARMM had the highest percentage of families practicing open defecation (9.4%). Bicol Region and MIMAROPA Region followed with 9.0% and 5.8%, respectively.
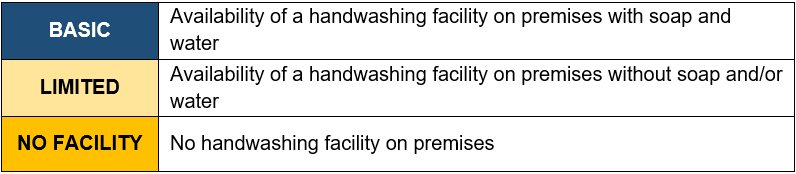
CAR records highest access to handwashing facilities
In 2024, among the 458 thousand families in CAR who gave permission to see their handwashing facilities, 98.4% had access to a basic handwashing facility – those with soap and water. This was 7.0% higher than the proportion recorded in 2022. Moreover, this was the highest percentage observed across all regions.
Figure 3. Percentage of Families by Service Level of Handwashing Facility,
CAR: 2022f and 2024p
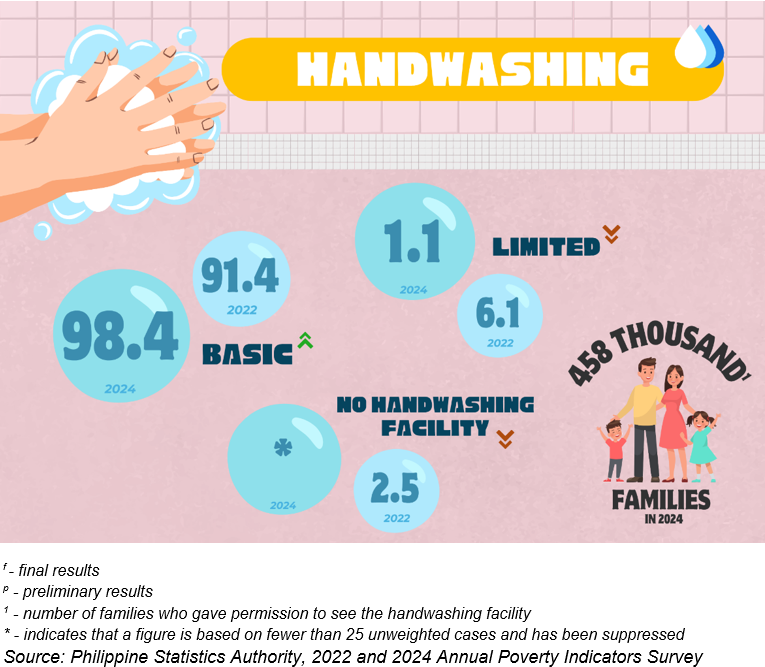
On the other hand, only 1.1% of families had access to a limited handwashing facility, 4.9% lower than the percentage of families with a limited handwashing facility in 2022. This pertains to families with available handwashing facility on premises but without soap and/or water. Further, the percentage of families with no handwashing facility significantly decreased by 7.0% in 2024.
Following CAR with the highest percentage of families with access to a basic handwashing facility were Central Luzon with 97.8%, Western Visayas with 97.6%, and Caraga with 97.2%. Conversely, BARMM and SOCCSKSARGEN had the lowest percentages with 82.4% and 83.3%, respectively. These two regions also recorded the highest proportion of families with no handwashing facilities – SOCCSKSARGEN with 12.0% and BARMM with 7.8%.
(SGD)
ALDRIN FEDERICO R. BAHIT, JR.
(Chief Statistical Specialist)
Officer-In-Charge
Special Order No: 2025ORDCAR-212
Designation Initials Date
CSS AFRBJ 31 July 2025
SS II KAMC 30 July 2025
Technical Notes
A. Objectives
The 2024 APIS aims to provide estimated for non-income indicators related to poverty. Specifically, it gathers information on factors that are correlated with poverty to determine the percent distribution of families in relation to the following indicators:
a. Owner-like possession of house and lot and the types of the materials used for roofs, walls, and floors of the housing units;
b. Main source of drinking water, and type of toilet and handwashing facility used at home;
c. Availability of electricity and ownership of household conveniences;
d. Internet usage and online transaction engagement;
e. Schooling status of family members aged 3 to 30 years;
f. Family members aged 6 to 11 years enrolled in Grade 1 to Grade 6;
g. Family members aged 12 to 17 years enrolled in junior high school (Grade 7 to Grade 10);
h. Educational assistance;
i. Health status of family members;
j. Availment of loan/s and its sources;
k. Availment of benefits from selected social protection program;
l. Perception of feeling safe in community and other institutions;
m. Access to government services; and
n. Migration in the past five years.
B. Concepts and Definitions
Respondent – is the head of the family or his/her spouse or any responsible adult family member who can provide accurate answers to all or most of the questions in the survey
Family – composed of persons bound by ties of kinship, who live together under the same roof and eat together or share the family food
WASH Service Levels
The APIS uses the following service ladders to benchmark and compare service levels across countries and monitor the SDG targets on drinking water, sanitation, and hygiene (WASH):
1. Drinking Water Service Levels
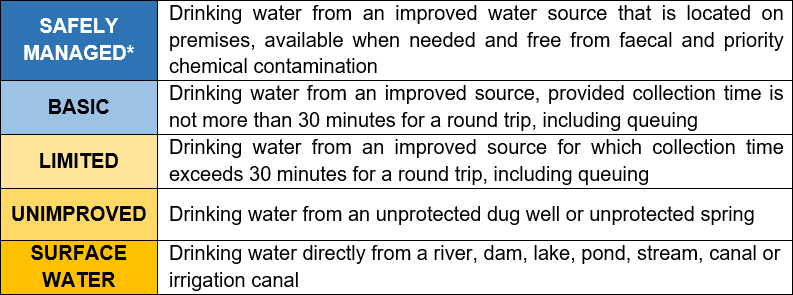
Improved drinking water sources are those which by nature of their design and construction have the potential to deliver safe water. Improved sources include piped water, boreholes or tubewells, protected dug wells, protected springs, rainwater, and delivered or packaged water (including bottled water and refilling stations). Water refilling stations and bottled water were previously treated as an improved source only if the water used for other purposed such as personal hygiene and cooking also comes from an improved source. For SDG monitoring, they will be treated as an improved source based on the new SDG criteria.
Note: *Safely managed service level requires testing drinking water for fecal or chemical contamination. For the 2024 APIS, water quality testing of drinking water was not conducted. Safely managed drinking water is defined as those sourced from the Community Water System piped into the family’s dwellings or yards/plots, provided that drinking water is always sufficient and the family is paying for the monthly water bill.
2. Sanitation Service Levels
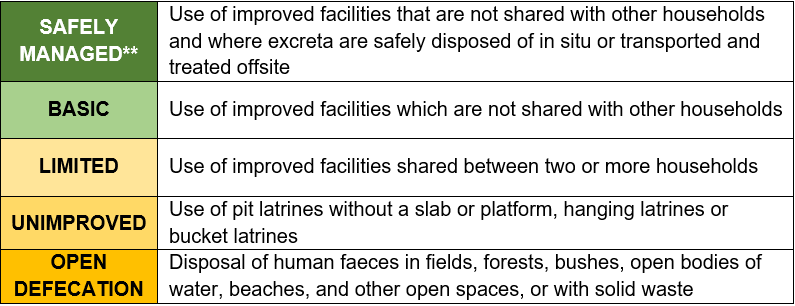
Improved sanitation facilities are those designed to hygienically separate human excreta from human contact. These include wet sanitation technologies such as flush and pour flush toilets connected to sewers, septic tanks or pit latrines, and dry sanitation technologies such as dry pit latrines with slabs and composting toilets.
Note: **In 2024 APIS, disposal and treatment of excreta were not very common within household levels or that the families were not aware how the excreta were treated, whether on site or transported and treated offsite. Hence, families using improved sanitation facilities were not classified as to using or not using safely managed sanitation services.
3. Handwashing Service Levels
| Attachment | Size |
|---|---|
|
|
1.15 MB |