

Release Date :
Reference Number :
24CAR32-142
Kalinga's 2023 CPI was higher by 5.3 index points
Consumer Price Index (CPI) of Kalinga in 2023 was 123.3, higher by 5.3 index points from last year’s CPI of 118.0
In 2023, the month of September posted the highest CPI at 125.7, followed by January at 125.3. The month of May had the lowest CPI with 121.1.
Table 1. Consumer Price Index by Month: Kalinga, 2022-2023
(2018=100)
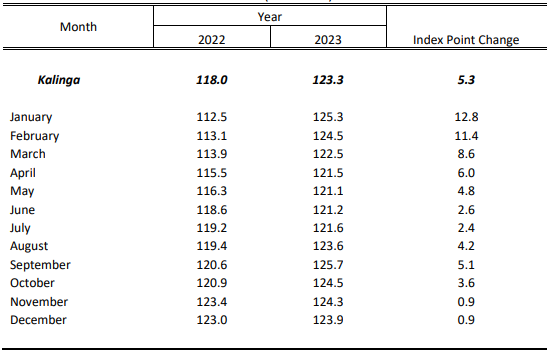
In terms of Index Point Change (IPC), the month of January showed the highest increase at 12.8, followed by February at 11.4and the least were November and December with 0.9 index point.
Alcoholic beverage and tobacco recorded the highest CPI in the province
Among the commodity groups, alcoholic beverage and tobacco recorded the highest CPI with175.7 in the province. The highest CPI with regards to alcoholic and beverage was recorded in the month of December with 179.4 followed by October with178.9 index points.
Financial Services came next with 146.0 index points. From January to December recorded CPI was 146.0.
Restaurant and accommodation services ranked 3rd with 144.5 index points.
- Fourth in rank is Health with 137.5 index point followed by Furnishing, household equipment and routine maintenance of the house with 131.6, Education with 126.9, and Clothing and footwear with 124.4 index point.
- Commodity groups with recorded CPI below the average were Transport with 122.9, Food and non-alcoholic beverage with 122.6, Personal care and miscellaneous goods and services with 119.4, Recreation, sports and culture with 114.3, and Housing, water, electricity, gas and other fuels with 110.9 index point.
Information and Communication had the lowest CPI among the commodity groups in the province at 101.4 index points.
Table 2 Consumer Price Index by Commodity Group and by Month: 2023, Kalinga
(2018=100)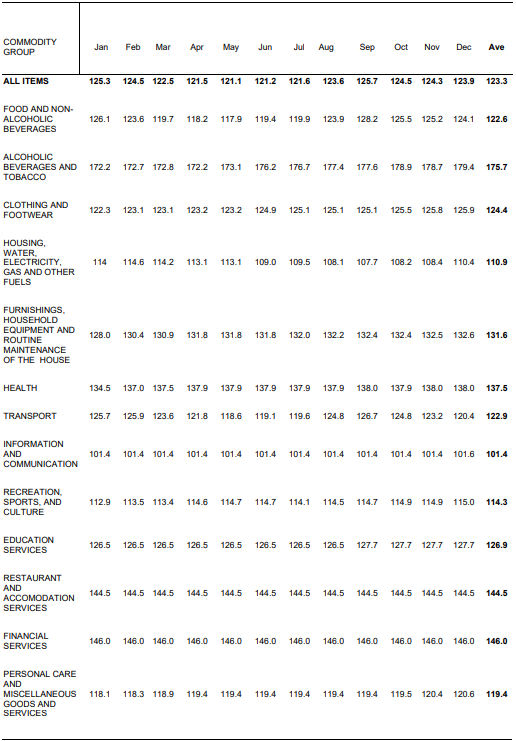
Recorded inflation rate of Kalinga was lower as compared of last year.
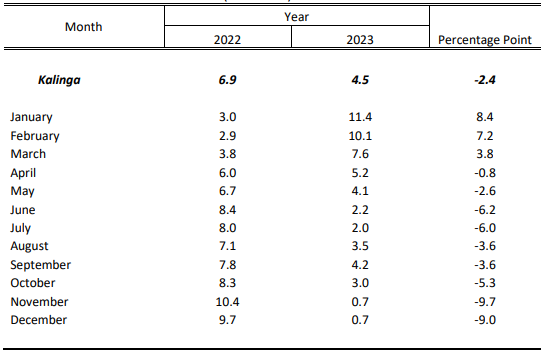
The overall change in prices of goods and services in Kalinga in year 2023 decreased to 4.5 percent, lower by 2.4 percentage points from last year.
In 2023, the month of January posted the highest inflation rate with 11.4 percent, an increase of 8.4 percentage points from last year, followed by February with 10.1 percent. March ranked 3rd with 7.6 percent.
The month of November and December has the lowest inflation rate with 0.7 percent. Inflation rate decreased by 9.7 and 9.0 percentage points respectively as compared to the same period last 2022.
- It was observed that inflation rate of Kalinga in 2023 decreased from April to December as compared last year.
Table 3. Inflation Rate by Month: 2022-2023, Kalinga
(2018=100)
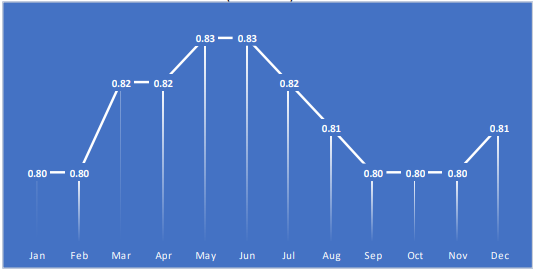
Purchasing Power of the Peso in Kalinga dropped to 81 centavos in 2023.
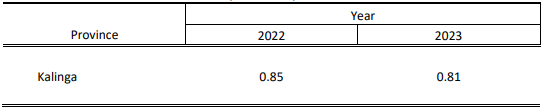
- In 2023 the value of peso in Kalinga dropped to 81 centavos from last year’s 85 centavos. This means that the market value of goods and services worth 81 centavos in 2018 were bought at one peso in 2023.
Table 4. Purchasing Power of the Peso: 2022-2023, Kalinga
(2018=100)
- In 2023, the purchasing power of the peso increased from 80 centavos in January to 81 centavos in December. The months of May and June recorded the highest purchasing power of peso at 83 centavos.
Figure 1. Purchasing Power of the Peso by Month: 2023, Kalinga
(2018=100)
TECHNICAL NOTES
Consumer Price Index (CPI) is the general measure of the change in the average retail prices of a market basket or collection of goods and services commonly purchased by the average Filipino household.
Inflation/Deflation Rate (IR) is the rate of change in the average price level between two periods (year on year/ month on month)
Purchasing Power of the Peso (PPP) measures how much the peso in the
reference year is worth in another yearBase Year (BY) is the reference point of the index number series at which
the index number is set to zero.Market Basket (MB) is a sample of goods and services used to represent all goods and services produced or bought.
(SGD)
MARIBEL M. DALAYDAY
Chief Statistical Specialist
| Attachment | Size |
|---|---|
|
|
449.29 KB |