

Release Date :
Reference Number :
SSR 2024-16
This Special Release discusses the 2023 Economic Performance of the Cordillera Administrative Region in the expenditure approach. |
Imports of goods and services in CAR posts highest growth in 2023
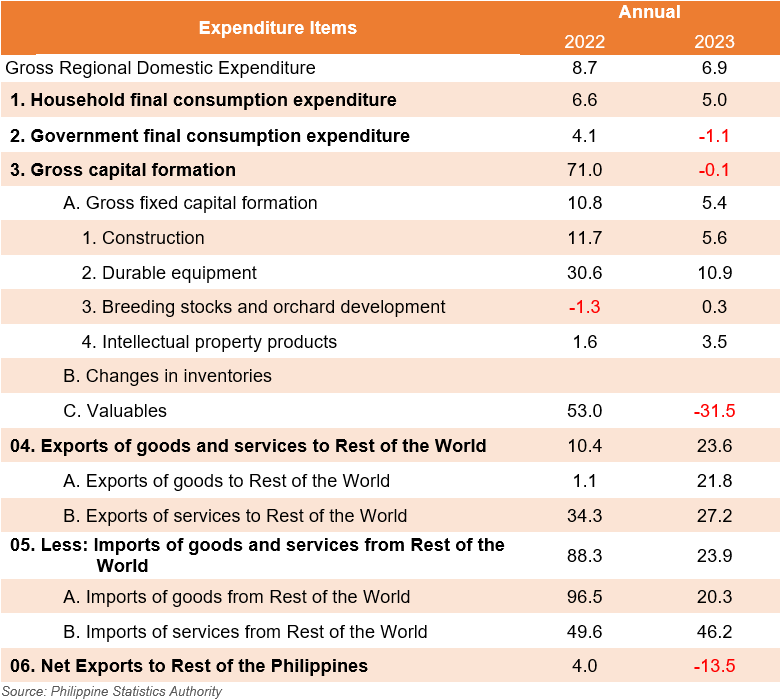
The Gross Regional Domestic Expenditure (GRDE) of the Cordillera region recorded a 6.9% growth rate in 2023 which was a slower growth compared to 8.7% the previous year. Among the major expenditure items, imports of goods and services from rest of the world posted the highest growth with 23.9% in 2023 from the 88.3% in 2022. Specifically, the imports of services from the rest of the world and imports of goods from the rest of the world accounted for 46.2% and 20.3%, respectively.
Exports of goods and services to rest of the world recorded the second highest growth with 23%. This showed an increase of 13.2 percentage points from the recorded 10.4% growth in 2022. This was followed by household final consumption expenditure (HFCE) with 5.0% growth.
In contrast, gross capital formation (GCF) declined from 71.4% in 2022 to -0.1% in 2023. Specifically, valuables accounted for -31.5% growth in 2023 from 53.0% in 2022. The government final consumption expenditure (GFCE) also regressed from 4.4% in 2022 to -1.1% in 2023.
Table 1. Growth Rates by Expenditure Item, CAR: 2022 to 2023
At Constant 2018 Prices, in Percent
HFCE is top contributor to GRDE growth
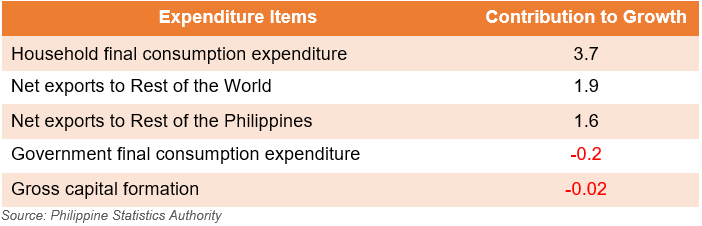
With the 6.9% GRDE growth rate in the region, HFCE had the largest contribution with 3.7 percentage points. This was followed by net exports to the rest of the world with 1.9 percentage points and net exports to the rest of the Philippines with 1.6 percentage points.
On the other hand, GFCE and GCF hindered the growth by -0.2 percentage points and -0.02 percentage points, respectively.
Table 2. Contribution to GRDE Growth, by Expenditure Item, CAR: 2022 to 2023
At Constant 2018 Prices, in Percentage Points
Percent share of HFCE is almost three-fourths
In terms of the share of expenditure items to the regional economy, HFCE recorded the highest percent share with 71.6%. This was followed by GFCE with 14.6%, GCF with 14.0%, and net exports to the rest of the world with 9.2%.
Meanwhile, a negative percent share was recorded by net exports to the rest of the Philippines with -9.4%.
Table 3. Share of Expenditure Items to the Regional Economy, CAR: 2023
At Constant 2018 Prices, in Percent

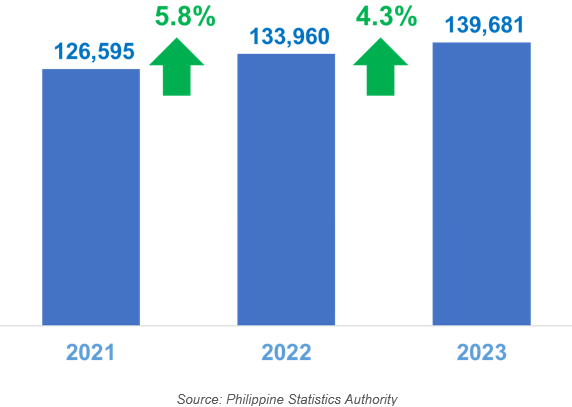
Per capita HFCE increases by 4.3%
The per capita HFCE in the region was estimated at PhP139,681 in 2023. This was 4.3% higher than the recorded PhP133,960 in 2022. This means that on the average, an individual member of a household spent PhP139,681 on final consumption of goods and services that includes purchase of consumer goods and services, barter transactions, goods and services in kind, and goods and services produced and consumed by the same individual.
Figure 1. Per Capita Household Final Consumption Expenditure, CAR: 2021 to 2023
At Constant 2018 Prices, in Percent
(SGD)
VILLAFE P. ALIBUYOG
Regional Director
/AFRBJ/RJPA/LMB
Technical Notes
The Gross Regional Domestic Expenditure (GRDE) is defined as the expenditure of residents of the region in the domestic territory plus their expenditures in other regions including the rest of the world. The GRDE is intended to complement the current series of the Gross Regional Domestic Product (GRDP). The GRDE and its components are compiled and released annually. These are valued at current and constant 2018 prices.
The GRDE estimation, which is the same with the GRDP, is pegged to the national estimates. These are allocated to the regions using surveys and administrative-based data/indicators for its regional distribution.
Household final consumption expenditure (HFCE) consists of expenditures made by resident households of the region (regardless of where such expenditure occurs) for their own final consumption on goods or services. This also includes purchases of consumer goods, estimated value of barter transactions, own account production and consumption of goods or services (i.e., paid domestic staff, imputed rent).
Government final consumption expenditure (GFCE) consists of expenditure, including expenditure whose value must be estimated indirectly, incurred by the general government on both individual consumption goods and services and collective consumption services.
Gross capital formation (GCF) is measured by the total value of the gross fixed capital formation, changes in inventories and acquisitions less disposals of valuables for a unit or sector.
Gross fixed capital formation (GFCF) is defined as the acquisition of produced assets (including purchases of second-hand assets), including the production of such assets by producers for their own use, minus disposals.
Construction (CNS) as capital formation refers to gross value or the total costs/expenditure incurred from all new construction, additions and alterations, major repair, erection of prefabricated buildings or structures on the site, and construction of a temporary nature. The PSNA defines construction as GFCF on dwellings, buildings, other structures, and land improvements.
Durable equipment (DEQ) are machinery and equipment that are used repeatedly or continuously in production processes for more than a year. It includes outlays on improvements and alteration of capital goods that significantly increase their productivity and/or expected life.
Breeding stocks and orchard development (BSOD) are cultivated biological resources that cover animal resources yielding repeat products and tree, crop and plant resources yielding repeat products whose natural growth and regeneration are under the direct control, responsibility and management of institutional units.
Intellectual Property Products (IPP) include expenditures on research and experimental development (R&D), software and databases, mineral exploration, and entertainment, artistic and literary originals. They are collectively known as IPP since expenditures on these items or their value reflects the underlying intellectual property they embody.
Inventories are produced assets that consist of goods, which came into existence in the current period or an earlier period, and that are held for sale, use in production or other use at a later date. Changes in inventories (CIN) are measured by the value of the entries into inventories less the value of withdrawals and less the value of any recurrent losses of goods held in inventories during the accounting period.
Acquisitions less disposals of Valuables (VAL) are net acquisition of produced goods of considerable value that are not used primarily for purposes of production or consumption but are held as stores of value over time. Valuables are expected to appreciate or at least not to decline in real value, nor to deteriorate over time under normal conditions. It can be acquired by any institutional units.
Exports of goods (EOG) to Rest of the World (ROW) consist of sales, barter, gifts or grants, of goods from residents to non-residents.
Imports of goods (IOG) from the ROW consist of purchases, barter, or receipts of gifts or grants, of goods by residents from non-residents.
Exports of services to the ROW are transactions/purchases of services by residents to non-residents.
Imports of Services from the ROW are transactions/purchases of services by non-residents to residents.
Net exports to the ROP is the difference between the sum of the Exports of goods and services to the ROP and sum of Imports of goods and services from the ROP.
| Attachment | Size |
|---|---|
|
|
2.09 MB |