

Release Date :
Reference Number :
SSR 2025-10
The Annual Survey of Philippine Business and Industry (ASPBI), one of the designated statistical activities of the Philippine Statistics Authority (PSA), generates essential statistics for economic planning and analysis. It is specifically designed to collect and generate information on the levels, structure, performance, and trends of economic activities of the formal sector of the country’s economy.
The 2022 ASPBI is the 50th in the series of annual surveys of establishments in the country. It was conducted nationwide in April 2023 with 2022 as reference period.
This Special Release discusses the performance of for all Water Supply; Sewerage, Waste Management and Remediation Activities (Section E) establishments. This section includes activities related to the management of various forms of waste, such as solid or non-solid industrial or household waste, as well as contaminated sites. The output of the waste or sewage treatment process can either be disposed of or become an input into other production processes. Activities of water supply are also grouped in this section, since they are often carried out in connection with, or by units also engaged in the treatment of sewage.
Water collection, treatment and supply industry establishments increase by 5.1% in 2022
The 2022 Annual Survey of Philippine Business and Industry (ASPBI) preliminary result showed that a total of 281,825 establishments were in the formal sector of the economy. Of these, 1,200 establishments were engaged in Water Supply, Sewerage, Waste Management and Remediation Activities. This accounted for 0.4% of the total establishments in the country. Further, this represents a 5.1% increase from the 1,142 establishments reported in 2021.
Establishments in this sector include water collection, treatment and supply, materials recovery, sewerage, waste collection, and waste treatment and disposal.
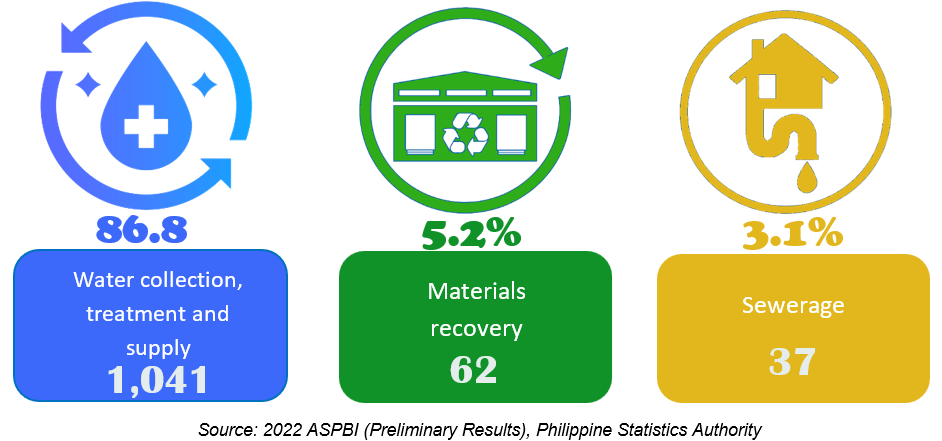
In terms of the number of establishments, the water collection, treatment and supply recorded the highest number of 1,041 establishments representing 86.8% of the total establishments for the sector. It was followed by materials recovery with 62 establishments (5.2%), and sewerage with 37 establishments (3.1%), respectively (Figure 1). Meanwhile, there were 32 establishments (2.7%) involved in waste collection, and 23 establishments (1.9%) involved in waste treatment and disposal. Remediation activities and other waste management services had the least number of 5 establishments (0.4%).
Figure 1. Top 3 Establishments for Water Supply Sewerage, Waste Management and Remediation Activities, Philippines: 2022
Establishments engaged in water supply, sewerage, waste management and remediation activities highest in CALABARZON
The region with the highest number of establishments engaged in water collection, treatment and supply industry in 2022 was CALABARZON with 221 establishments. This represents 18.4% of the total establishments under the section. It was followed by Central Luzon with 187 establishments or about 15.6% of the total establishments for the section. Central Visayas came third with 134 establishments (11.2%). CAR placed 16th among all regions with 16 establishments (1.3%), and next to BARMM, the region with the lowest number of establishments on the section with 11 (0.9%).
Employment in Water Supply, Sewerage, Waste Management and Remediation Activities Section increases by 6.6%
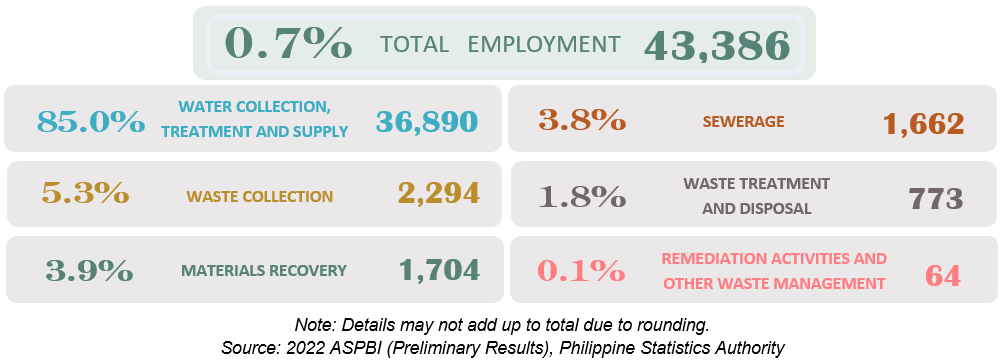
In 2022, total employment of the establishments in the country reached 6,361,802 of which, about 0.7% of the employees’ equivalent to 43,386 were employed in water supply, sewerage, waste management and remediation activities. This was an increase of 6.6 % or 2,669 employees from the record of 40,717 employees in 2021. The number of paid employees in the sector also increased to 43,163 in 2022 from the recorded 40,285 in the previous year. This had an increment of 7.1% equivalent to 2,878 paid workers than that of 2021 (Figure 2).
Meanwhile, the average employment per establishment engaged in water supply, sewerage, waste management and remediation activities were at 36 workers per establishment. This figure was similar to the average employment recorded in 2021.
Among the regions, NCR had the highest average employment with 81 workers per establishment. It was followed by BARMM with 53 workers per establishment. Northern Mindanao came third with 52 workers per establishment. CAR posted 41 workers per establishment, while MIMAROPA region had the least number of average worker per establishment for the sector with 22 employees.
Figure 2. Employment for Water Supply Sewerage, Waste Management and Remediation Activities, Philippines: 2022
Waste collection, treatment and supply industry group employs the highest
The highest employment in establishments operating under the Water Supply, Sewerage, Waste Management and Remediation Activities in 2022 was the waste collection, treatment and supply industry group with a total of 36,890 workers. This represents 85.0% of the total employment under the section.
Meanwhile, waste collection industry posted the highest number of average number of workers among the industry groups with 72 workers per establishment. It was followed by sewerage with an average of 45 workers per establishment. Meanwhile, remediation activities and other waste management services had the lowest average number of employees per establishment with 13 workers.
Employees in waste collection, treatment and supply industry receive highest average annual compensation
In 2022, total compensation paid to employees of the section in 2022 amounted to PhP18.8 billion. This translates to an average annual compensation of PhP436.0 thousand per paid employee. This had an increment of 6.0% from that of the recorded average annual compensation of PhP411.43 thousand per paid employee in 2021 (Figure 3).
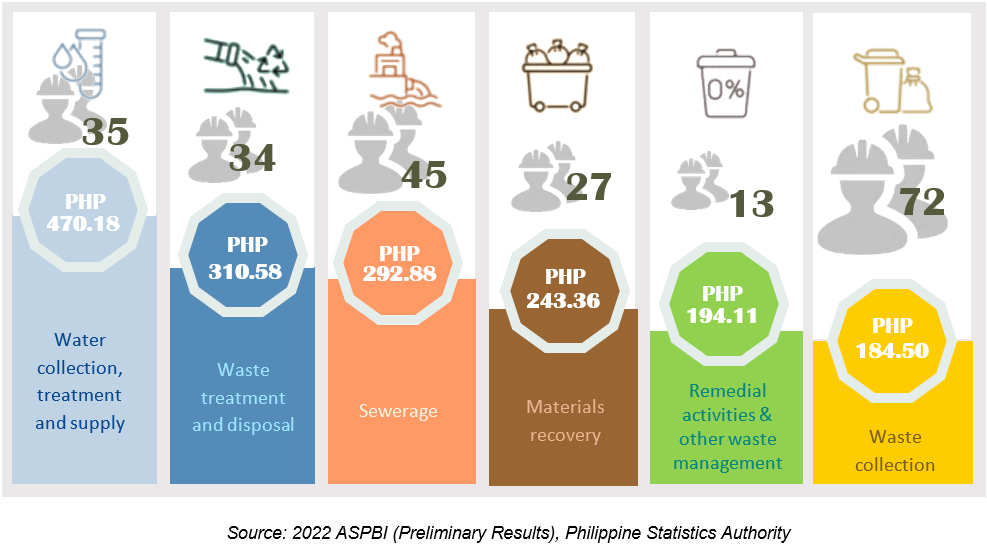
The water collection, treatment and supply industry paid the highest average annual compensation of PhP470.18 thousand per paid employee in 2022 among the industry groups. Further, it is the only industry group of the section that paid an average annual compensation higher than the national average of PhP436.03 thousand.
Waste treatment and disposal industry came second with the highest average annual compensation per paid employee of PhP310.58 thousand. Sewerage industry group came third with PhP292.88 thousand average annual compensation per employee. Meanwhile, waste collection industry group paid the lowest with an average of PhP184.05 thousand per employee annually.
Figure 3. Annual Average Compensation of Employees (in Thousand Pesos) and Average Worker Per Establishment By Industry Group for Water Supply Sewerage, Waste Management and Remediation Activities, Philippines: 2022
Among the regions, employees working in the Water Supply Sewerage, Waste Management and Remediation Activities were paid the highest with average annual compensation of PhP784.47 thousand in NCR, followed by employees in CAR with PhP455.90 thousand, and BARMM with PhP451.64 thousand average annual compensation per paid employee. Employees of establishments in the three regions were paid higher than the national average annual compensation of PhP436,03 thousand. Meanwhile, employees in Eatsern Visayas received the lowest average annual compensation with PhP281.70 thousand in 2022.
Water collection, treatment and supply industry group contributes the highest share of 121.2 billion pesos in revenue
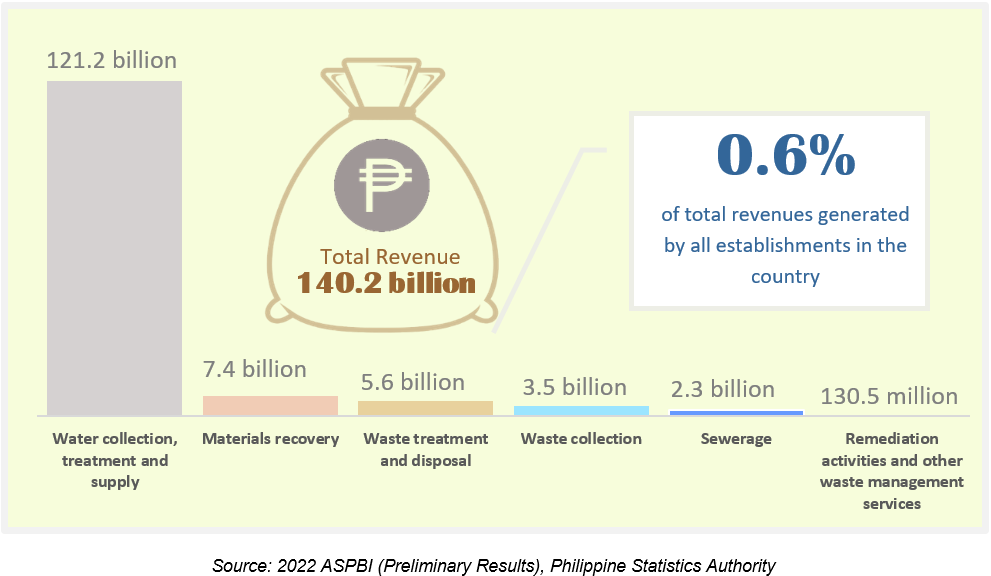
The total revenue of all establishments in the country reached PhP23.6 trillion in 2022, of which 0.6% equivalent to PhP140.2 billion was contributed by establishments engaged in Water Supply, Sewerage, Waste Management And Remediation Activities (Figure 4). Among the industry group in this section, the water collection, treatment and supply contributed the highest revenue with PhP121.2 billion. This accounted for 86.4% of the total revenue generated by the section. The share of other industry groups were: PhP7.4 billion for materials recovery (5.3%), PhP5.6 billion for waste treatment and disposal (4.0%), PhP3.5 billion for waste collection (2.5%), and PhP2.34 billion for sewerage. The lowest, amounting to PhP130.5 million, was contributed by remediation activities and other waste management services (0.1%).
Figure 4. Revenue Generated By Industry Group for Water Supply Sewerage, Waste Management and Remediation Activities, Philippines: 2022
Among the regions, NCR shared the highest revenue with PhP79.2 billion, which accounted to more than half (56.5%) of the total revenue generated by the section. Central Luzon followed with PhP15.4 billion contributing about 11.0% to total revenue and CALABARZON with PhP14.4 billion accounting 10.3% of the total revenue generated under the Water Supply, Sewerage, Waste Management And Remediation Activities.
Water collection, treatment and supply industry group incurs the highest expense
The industry group that incurred the highest total expense in 2022 was water collection, treatment and supply with PhP101.9 billion. This accounted for 87.0% of the total expense for the section. Meanwhile, the rest of the industry groups spent the lowest with waste treatment and disposal spending PhP5.6 billion (4.4%), materials recovery with PhP4.9 billion expense (4.3%), waste collection with total of PhP2.8 billion (2.4%) expense, sewerage with PhP2.1 billion (0.2%) expense, and remediation activities and other waste management services with PhP108.5 million (less than 0.1%) expense.
Among the regions, NCR incurred the highest expense with PhP64.9 billion representing 55.4% of the total expense for the section. It was followed by CALABARZON with PhP13.0 billion expense (11.1%), and Central Luzon with PhP12.62 billion (10.8%).
Highest return recorded for materials recovery industry group
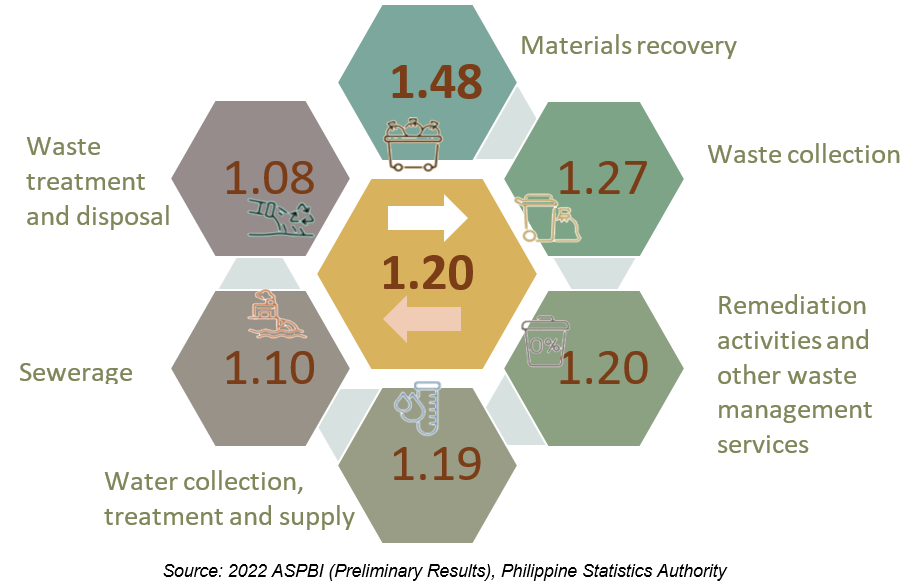
Water Supply, Sewerage, Waste Management and Remediation Activities recorded a revenue per expense ratio of 1.20 in 2022. This corresponds to a revenue generated of PhP 1.20 for every peso spent. This increased by 0.8% compared to the recorded revenue per peso expense ratio of 1.19 in 2021.
Materials recovery industry group recorded the highest return for the section at 1.48 in 2022. It was followed by waste collection industry group with 1.27 expense ratio, and remediation activities and other waste management services at 1.20. Materials recovery also recorded the highest revenue per expense ratio of 1.48 among the section’s industry groups. Meanwhile, waste treatment and disposal recorded the lowest return with revenue per expense ratio of 1.08.
The revenue per expense ratio among the regions was registered the highest in Eastern Visayas with 1.70. It was followed by Central Visayas with 1,28, and Caraga with 1.23.
Figure 5. Revenue Per Expense Ratio By Industry Group for Water Supply Sewerage, Waste Management and Remediation Activities, Philippines: 2022
(SGD)
VILLAFE P. ALIBUYOG
Regional Director
Designation Initials Date
CSS AFRBJ March 13, 2025
SSS WBM
SS II JRB March 10, 2025
Technical Notes
Establishment is an economic unit under a single ownership and control, i.e. under a single entity, engaged in one or predominantly one kind of economic activity at a single fixed location. An establishment is categorized by its economic organization, legal organization, industrial classification, employment size, and geographic location.
Waste Collection, Treatment and Supply industry includes the collection, treatment and distribution of water for domestic and industrial needs. Collection of water from various sources, as well as distribution by various means is included.
Sewerage division includes the operation of sewer systems or sewage treatment facilities that collect, treat, and dispose of sewage.
Waste Collection includes the collection of wastes materials.
Waste Treatment and Disposal activities includes the treatment and disposal of waste materials.
Materials Recovery includes local hauling of waste materials and the operation of materials recovery facilities (i.e. those that sort recoverable materials from a waste stream).
Remediation activities and other waste management services includes the provision of remediation services, i.e. the cleanup of contaminated buildings and sites, soil, surface or ground water.
Total Employment (TE) refers to the total number of persons who work in or for the establishment. This includes paid employees, working owners, unpaid workers, and all employees who work full-time or part-time including seasonal workers. Also included are persons on short-term leave such as those on sick, vacation or annual leaves, and on strike.
Paid employees are all persons working in the establishment and receiving pay, as well as those working away from the establishment paid by and under the control of the establishment. Included are all employees on sick leave, paid vacation or holiday. Excluded are consultants, home workers, receiving pure commissions only, and workers on indefinite leave.
Expense refers to cost incurred by the establishment during the year whether paid or payable. This is treated on a consumed basis. Valuation is a purchaser price including taxes and other charges, net of rebates, returns and allowances. Goods and services received by the establishment from other establishments of the same enterprise are valued as though purchased.
Compensation is the sum of salaries and wages, separation/retirement/terminal pay, gratuities and payments made by the employer on behalf of the employees such as contribution to SSS/GSIS, ECC, PhilHealth, Pag-ibig, etc.
Salaries and wages are payments in cash or in kind to all employees, prior to deductions for employee’s contributions to SSS/GSIS, withholding tax, etc. Included are total basic pay, overtime pay and other benefits.
Income or Revenue refers to cash received and receivables for goods/products and by-products sold, and services rendered. Valuation is at producer prices (ex-establishment) net of discounts and allowances, including duties and taxes but excluding subsidies.
| Attachment | Size |
|---|---|
|
|
573.78 KB |