

Release Date :
The 2015 Family Income and Expenditure Survey (FIES) is a nationwide survey of households undertaken every three years. It is the main source of data on family income and expenditure, which include among others, levels of consumption by item of expenditure as well as sources of income in cash and in kind. The results of FIES provide information on the levels of living and disparities in income of Filipino families, as well as their spending patterns.
Average family income in CAR is 23.5 thousand pesos monthly
- In 2015, families in the Cordillera Administrative Region (CAR) had an average annual income of 282 thousand pesos. In comparison, the annual expenditure for the same year was 209 thousand pesos on average. These figures meant an average annual savings of 73 thousand pesos per family (Table 1).
- The average family income of the region increased by 9.7 percent from 2012 to 2015 and by 28.8 percent from 2009 to 2015.
- The region’s average annual expenditure also increased by 11.2 percent from 2012 to 2015 and by 20.1 percent from 2009 to 2015.

- Adjusting for the inflation using 2006 prices, the average annual family income in CAR in 2015 would be valued at 189 thousand pesos while the average annual family expenditure would be valued at 152 thousand pesos.
Richest have income more than 10 times that of the poorest
- Families were grouped and ranked into per capita income deciles. The richest decile represents families belonging to the highest ten percent in terms of per capita income, while the poorest decile represents families in the lowest ten percent. From 2009 to 2015, average annual family income in all deciles increased.
- In 2015, the mean family income in the region ranged from 72 thousand pesos for the 1st income decile (poorest) to 756 thousand pesos for the 10th income decile (richest).
- The average annual family income of the tenth decile in 2015 was more than 10 times that of the first decile.

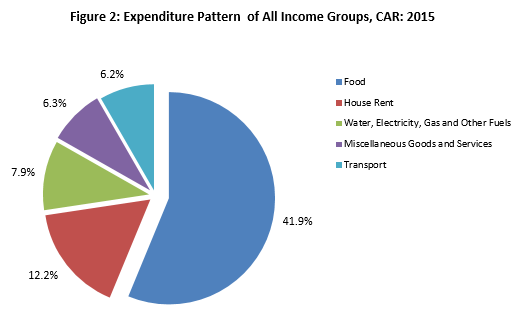
Spending on house rental and utilities remain second to food expenses
- Close to 42 percent of the total expenses of all income groups in 2015 were on food, followed by spending on house rental which is at 12.2 percent.
- The percent share of expenditure on Water, Electricity, Gas and Other Fuels was third which was 7.9 percent.
- Poor families spent more on alcoholic beverages and tobacco (2.6% of the total expenditure) than on education (2.3% of the total expenditure).
- The same pattern was observed in 2012, with alcoholic beverages and tobacco getting 2.4 percent of the total expenditure, while education, 2.0 percent.
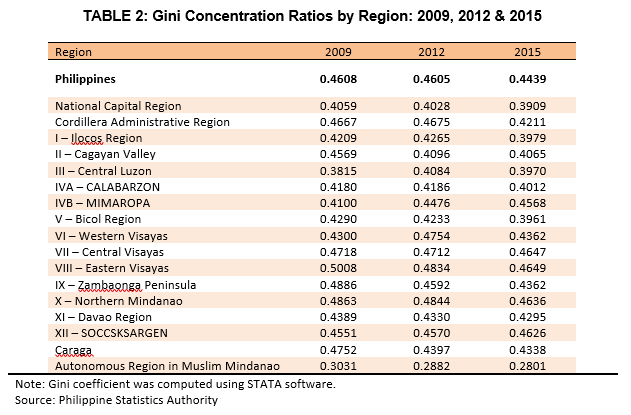
Income disparity remains wide but improved in 2015
- The Gini coefficient, which is a measure of income inequality within a population, was estimated at 0.4439 for year 2015 for the whole Philippines. This figure was lower than the 2012 ratio of 0.4605, which may indicate some improvement in the income distribution among families (Table 2). A Gini coefficient ranges from 0 to 1, with 0 indicating perfect income equality among families, while a value of 1 indicates absolute income inequality.
-
Five regions had higher coefficients than the national. They were Eastern Visayas (0.4649), Central Visayas (0.4647), Northern Mindanao (0.4636), SOCCSKSARGEN (0.4626), and MIMAROPA (0.4568). ARMM had the lowest Gini coefficient at 0.2882.
-
The Gini coefficient of income of families in CAR was estimated at 0.4211 in 2015, lower than the estimated coefficient in 2012 at 0.4675. The decline indicated improvement in income distribution in the region.
Technical Notes
Inflation is a sustained increase in the general level of prices for goods and services.
Current Price is the price at which goods are currently being sold in the market.
Income Decile are groupings that result from ranking either all households or all persons in the population in ascending order according to income, and then dividing the population into ten equal groups, each comprising approximately 10% of the estimated population.
Gini Coefficient is a statistical measure of the degree of variation or inequality represented in a set of values, used especially in analyzing income inequality.